
معیارها نوع اصلی اطلاعات استخراج شده از بنچمارکهای شما هستند. آنها به صورت یک List به تابع measureRepeated ارسال میشوند که به شما امکان میدهد چندین معیار اندازهگیری شده را به طور همزمان مشخص کنید. حداقل یک نوع معیار برای اجرای بنچمارک مورد نیاز است.
قطعه کد زیر زمانبندی فریم و معیارهای بخش ردیابی سفارشی را ثبت میکند:
کاتلین
benchmarkRule.measureRepeated(
    packageName = TARGET_PACKAGE,
    metrics = listOf(
        FrameTimingMetric(),
        TraceSectionMetric("RV CreateView"),
        TraceSectionMetric("RV OnBindView"),
    ),
    iterations = 5,
    // ...
)
جاوا
benchmarkRule.measureRepeated(
    TARGET_PACKAGE,     // packageName
    Arrays.asList(      // metrics
        new StartupTimingMetric(),
        new TraceSectionMetric("RV CreateView"),
        new TraceSectionMetric("RV OnBindView"),
    ),
    5,                  // Iterations
    // ...
);
در این مثال، RV CreateView و RV OnBindView شناسههای بلوکهای قابل ردیابی هستند که در RecyclerView تعریف شدهاند. کد منبع برای متد createViewHolder() نمونهای از نحوه تعریف بلوکهای قابل ردیابی در کد خودتان است.
StartupTimingMetric ، TraceSectionMetric ، FrameTimingMetric و PowerMetric بعداً در این سند به تفصیل پوشش داده شدهاند. برای مشاهده لیست کامل معیارها، به زیرکلاسهای Metric مراجعه کنید.
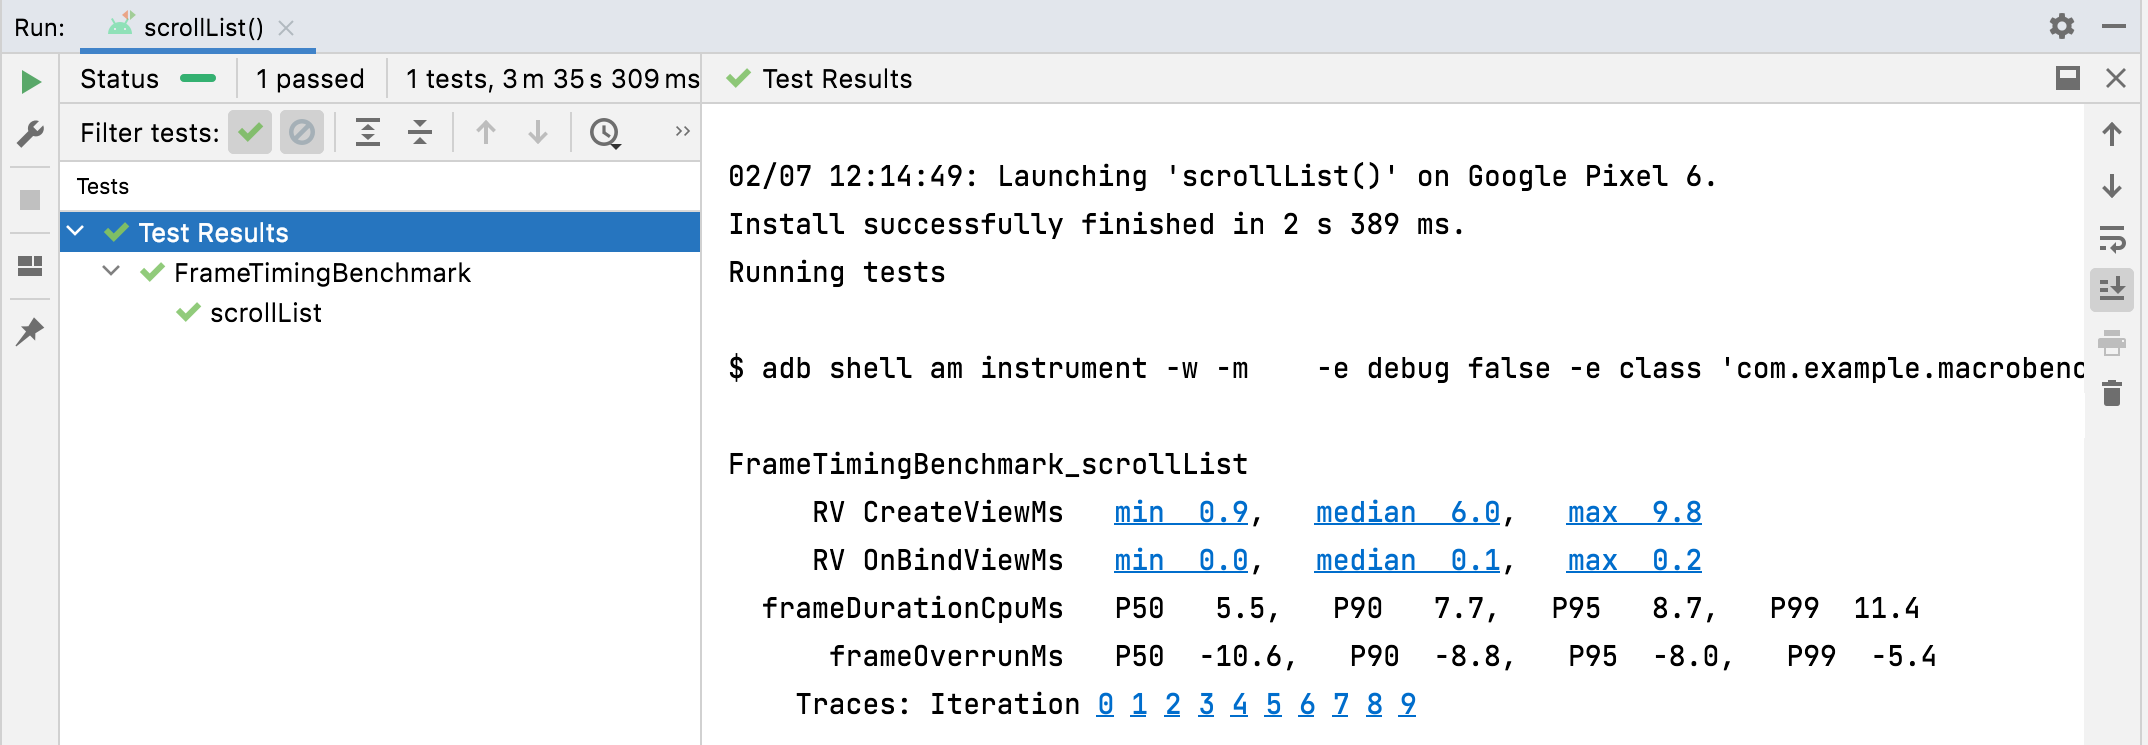
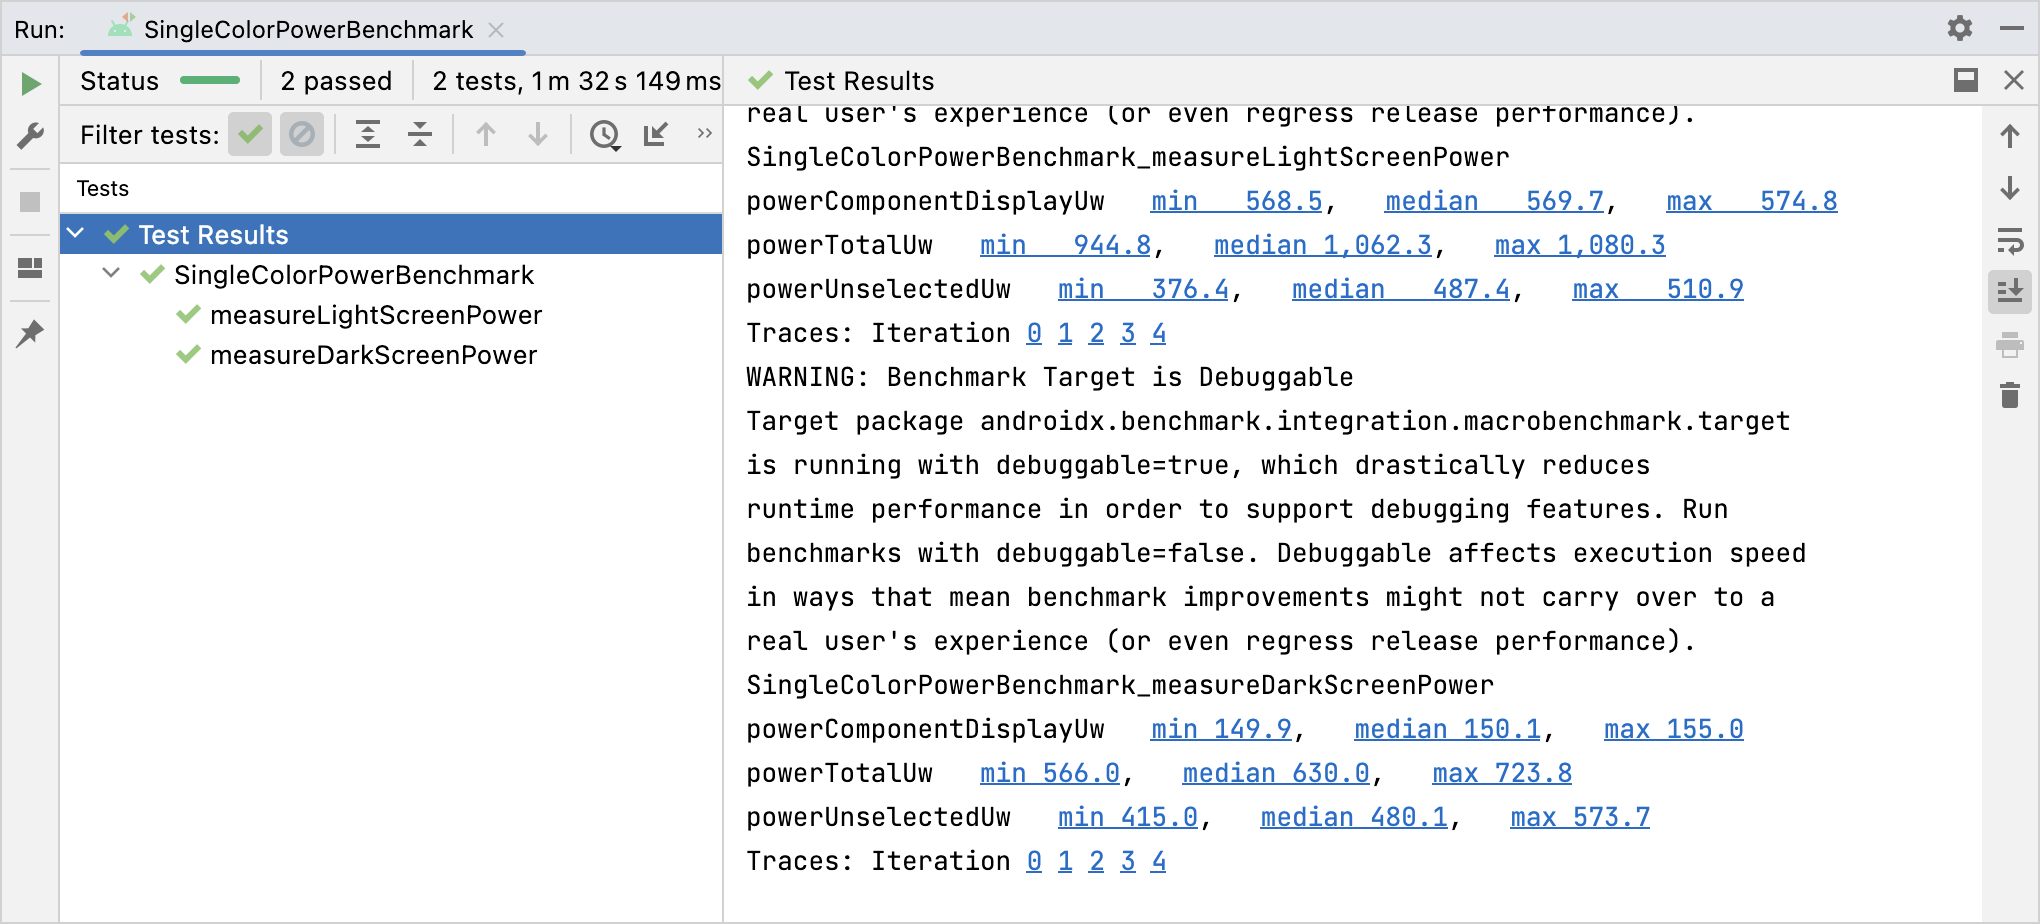
نتایج بنچمارک همانطور که در شکل ۱ نشان داده شده است، به اندروید استودیو ارسال میشوند. اگر چندین معیار تعریف شده باشد، همه آنها در خروجی ترکیب میشوند.
TraceSectionMetric و FrameTimingMetric .معیار زمانبندی استارتاپ
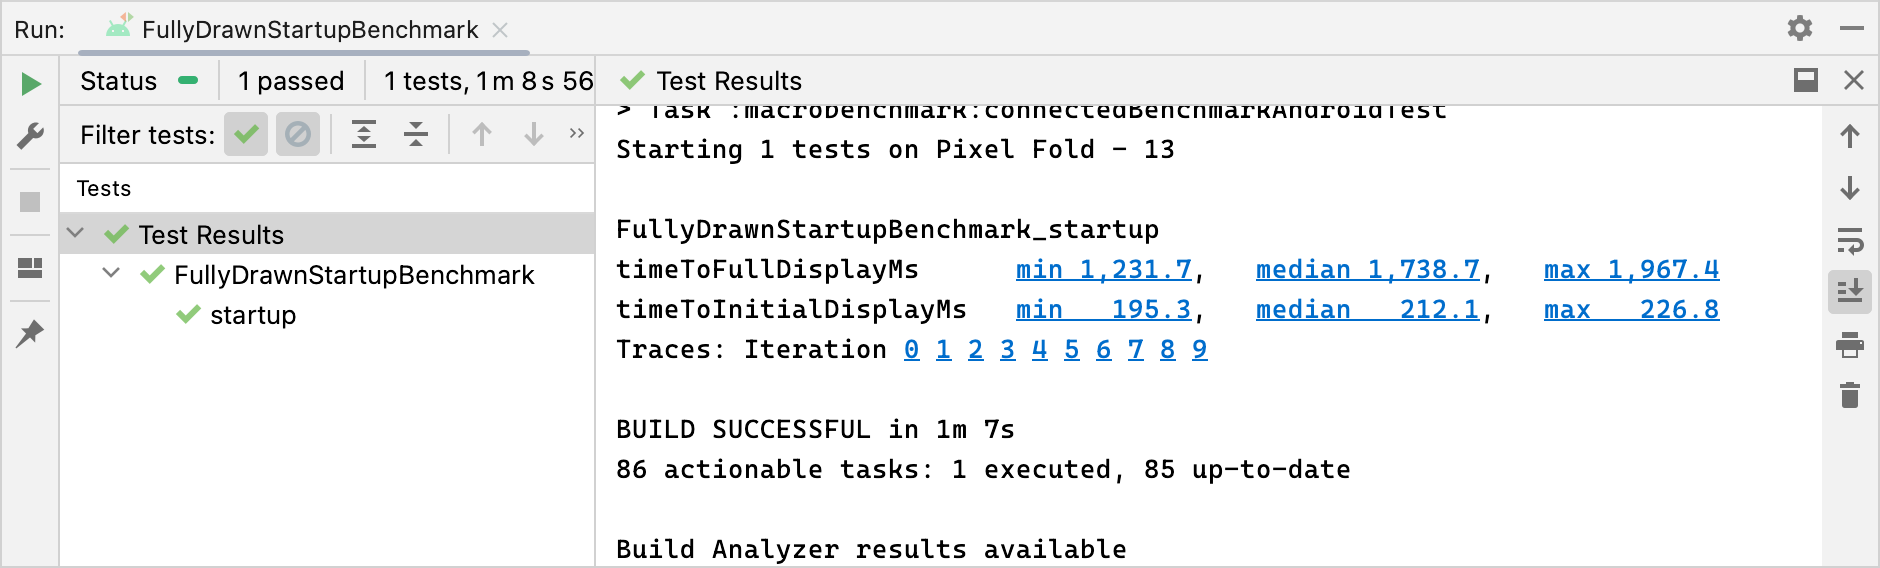
StartupTimingMetric معیارهای زمانبندی راهاندازی برنامه را با مقادیر زیر ثبت میکند:
-
timeToInitialDisplayMs: مدت زمان از زمانی که سیستم یک intent راهاندازی (launch intent) دریافت میکند تا زمانی که اولین فریم ازActivityمقصد را رندر میکند. -
timeToFullDisplayMs: مدت زمان از زمانی که سیستم یک intent راهاندازی را دریافت میکند تا زمانی که برنامه با استفاده از متدreportFullyDrawn()به طور کامل ترسیم میشود. این اندازهگیری با تکمیل رندر اولین فریم پس از فراخوانیreportFullyDrawn()یا حاوی آن، متوقف میشود. این اندازهگیری ممکن است در اندروید ۱۰ (سطح API ۲۹) و قبل از آن در دسترس نباشد.
StartupTimingMetric مقادیر حداقل، میانه و حداکثر را از تکرارهای راهاندازی خروجی میدهد. برای ارزیابی بهبود راهاندازی، باید روی مقادیر میانه تمرکز کنید، زیرا آنها بهترین تخمین از زمان معمول راهاندازی را ارائه میدهند. برای اطلاعات بیشتر در مورد آنچه در زمان راهاندازی برنامه نقش دارد، به زمان راهاندازی برنامه مراجعه کنید.
StartupTimingMetric .فریم تایمینگ متریک
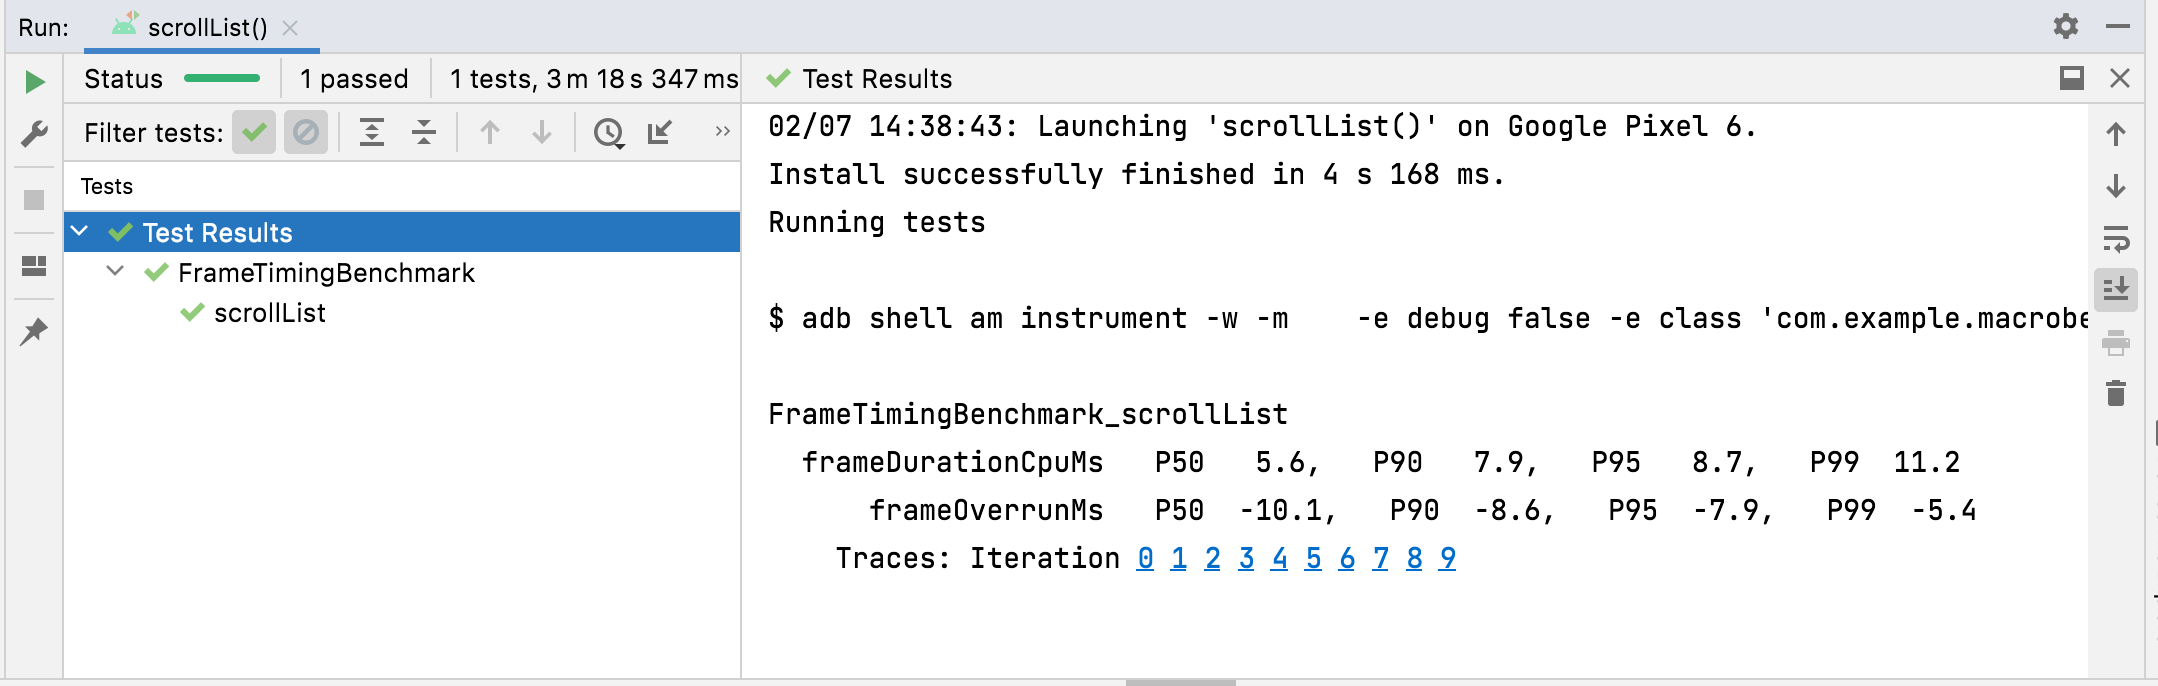
FrameTimingMetric اطلاعات زمانبندی را از فریمهای تولید شده توسط یک معیار، مانند پیمایش یا انیمیشن، ثبت میکند و مقادیر زیر را خروجی میدهد:
-
frameOverrunMs: مدت زمانی که یک فریم مشخص، مهلت خود را از دست میدهد. اعداد مثبت نشاندهندهی یک فریم از دست رفته و پرش یا وقفهی قابل مشاهده هستند. اعداد منفی نشان میدهند که یک فریم چقدر سریعتر از مهلت خود است. توجه: این فقط در اندروید ۱۲ (سطح API ۳۱) و بالاتر در دسترس است. -
frameDurationCpuMs: مدت زمانی که طول میکشد تا فریم روی CPU، هم روی نخ رابط کاربری و همRenderThreadتولید شود.
این اندازهگیریها در توزیعی از صدکهای ۵۰، ۹۰، ۹۵ و ۹۹ جمعآوری شدهاند.
برای اطلاعات بیشتر در مورد نحوه شناسایی و بهبود فریمهای کند، به رندرینگ کند مراجعه کنید.
FrameTimingMetric .ردیابی بخش متریک
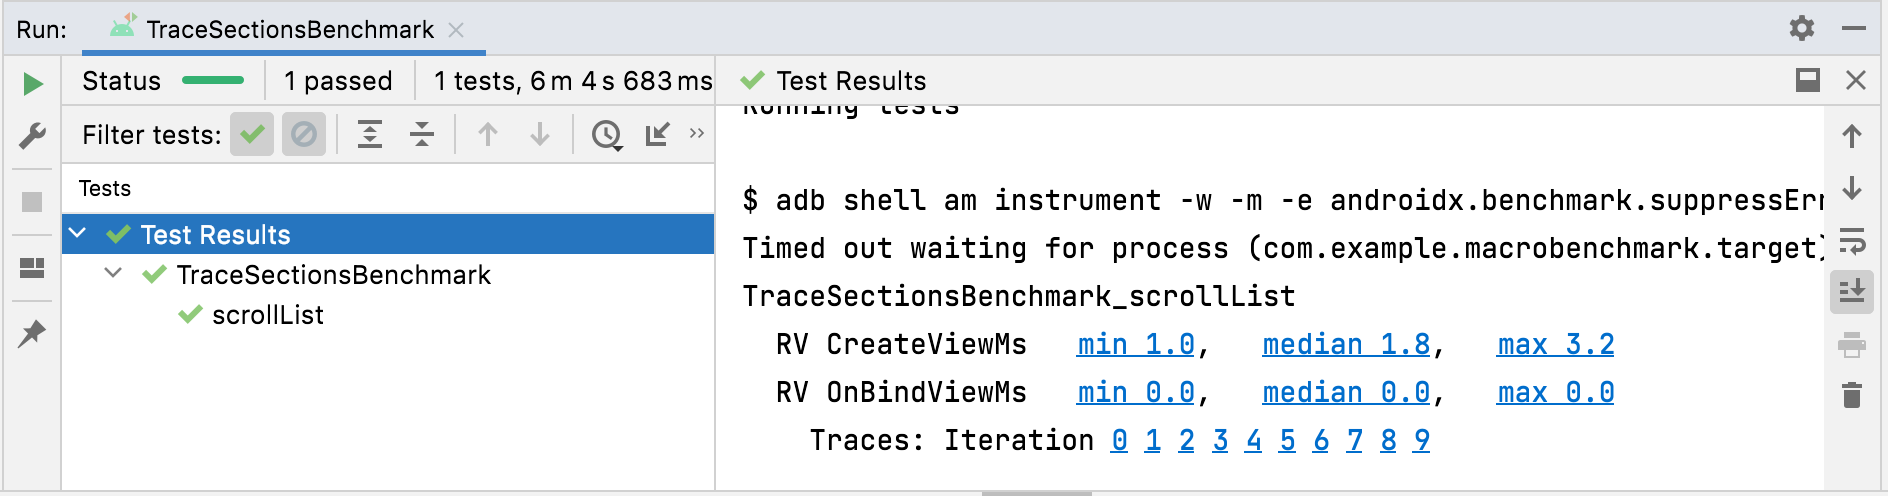
TraceSectionMetric تعداد دفعاتی که یک بخش ردیابی با sectionName ارائه شده مطابقت دارد و مدت زمان لازم برای آن را ثبت میکند. برای زمان، حداقل، میانه و حداکثر زمان را بر حسب میلیثانیه نمایش میدهد. بخش ردیابی یا با فراخوانی تابع trace(sectionName) یا کد بین Trace.beginSection(sectionName) و Trace.endSection() یا انواع async آنها تعریف میشود. این تابع همیشه اولین نمونه از یک بخش ردیابی ثبت شده در طول اندازهگیری را انتخاب میکند. به طور پیشفرض فقط بخشهای ردیابی را از بسته شما خروجی میدهد. برای شامل کردن فرآیندهای خارج از بسته خود، targetPackageOnly = false قرار دهید.
برای اطلاعات بیشتر در مورد ردیابی، به «مروری بر ردیابی سیستم» و «تعریف رویدادهای سفارشی» مراجعه کنید.
TraceSectionMetric .پاورمتریک
PowerMetric تغییر در توان یا انرژی را در طول مدت آزمایش شما برای دستههای توان ارائه شده ثبت میکند. هر دسته انتخاب شده به زیرمولفههای قابل اندازهگیری خود تجزیه میشود و دستههای انتخاب نشده به معیار "انتخاب نشده" اضافه میشوند.
این معیارها مصرف کل سیستم را اندازهگیری میکنند، نه مصرف به ازای هر برنامه، و محدود به دستگاههای Pixel 6، Pixel 6 Pro و مدلهای جدیدتر هستند:
-
power<category>Uw: میزان توان مصرفی در طول مدت آزمایش شما در این دسته. -
energy<category>Uws: مقدار انرژی منتقل شده در واحد زمان برای مدت زمان آزمایش شما در این دسته.
دسته بندی ها شامل موارد زیر است:
-
CPU -
DISPLAY -
GPU -
GPS -
MEMORY -
MACHINE_LEARNING -
NETWORK -
UNCATEGORIZED
در برخی از دستهها، مانند CPU ، ممکن است جدا کردن کار انجام شده توسط سایر فرآیندها از کار انجام شده توسط برنامه خودتان دشوار باشد. برای به حداقل رساندن تداخل، برنامهها و حسابهای غیرضروری را حذف یا محدود کنید.
PowerMetric .برای شما توصیه میشود
- توجه: متن لینک زمانی نمایش داده میشود که جاوا اسکریپت غیرفعال باشد.
- ایجاد پروفایلهای پایه {:#creating-profile-rules}
- نوشتن یک ماکروبنچمارک
- تحلیل و بهینهسازی شروع به کار اپلیکیشن {:#app-startup-analysis-optimization}