
المقاييس هي النوع الرئيسي من المعلومات المستخرَجة من مقاييس الأداء. يتم تمريرها إلى الدالة measureRepeated كـ List، ما يتيح لك تحديد مقاييس متعدّدة في الوقت نفسه. يجب توفّر نوع واحد على الأقل من المقاييس لتتمكّن من تشغيل مقياس الأداء.
يلتقط مقتطف الرمز البرمجي التالي مقاييس توقيت اللقطات وقسم التتبُّع المخصّص:
Kotlin
benchmarkRule.measureRepeated(
    packageName = TARGET_PACKAGE,
    metrics = listOf(
        FrameTimingMetric(),
        TraceSectionMetric("RV CreateView"),
        TraceSectionMetric("RV OnBindView"),
    ),
    iterations = 5,
    // ...
)
Java
benchmarkRule.measureRepeated(
    TARGET_PACKAGE,     // packageName
    Arrays.asList(      // metrics
        new StartupTimingMetric(),
        new TraceSectionMetric("RV CreateView"),
        new TraceSectionMetric("RV OnBindView"),
    ),
    5,                  // Iterations
    // ...
);
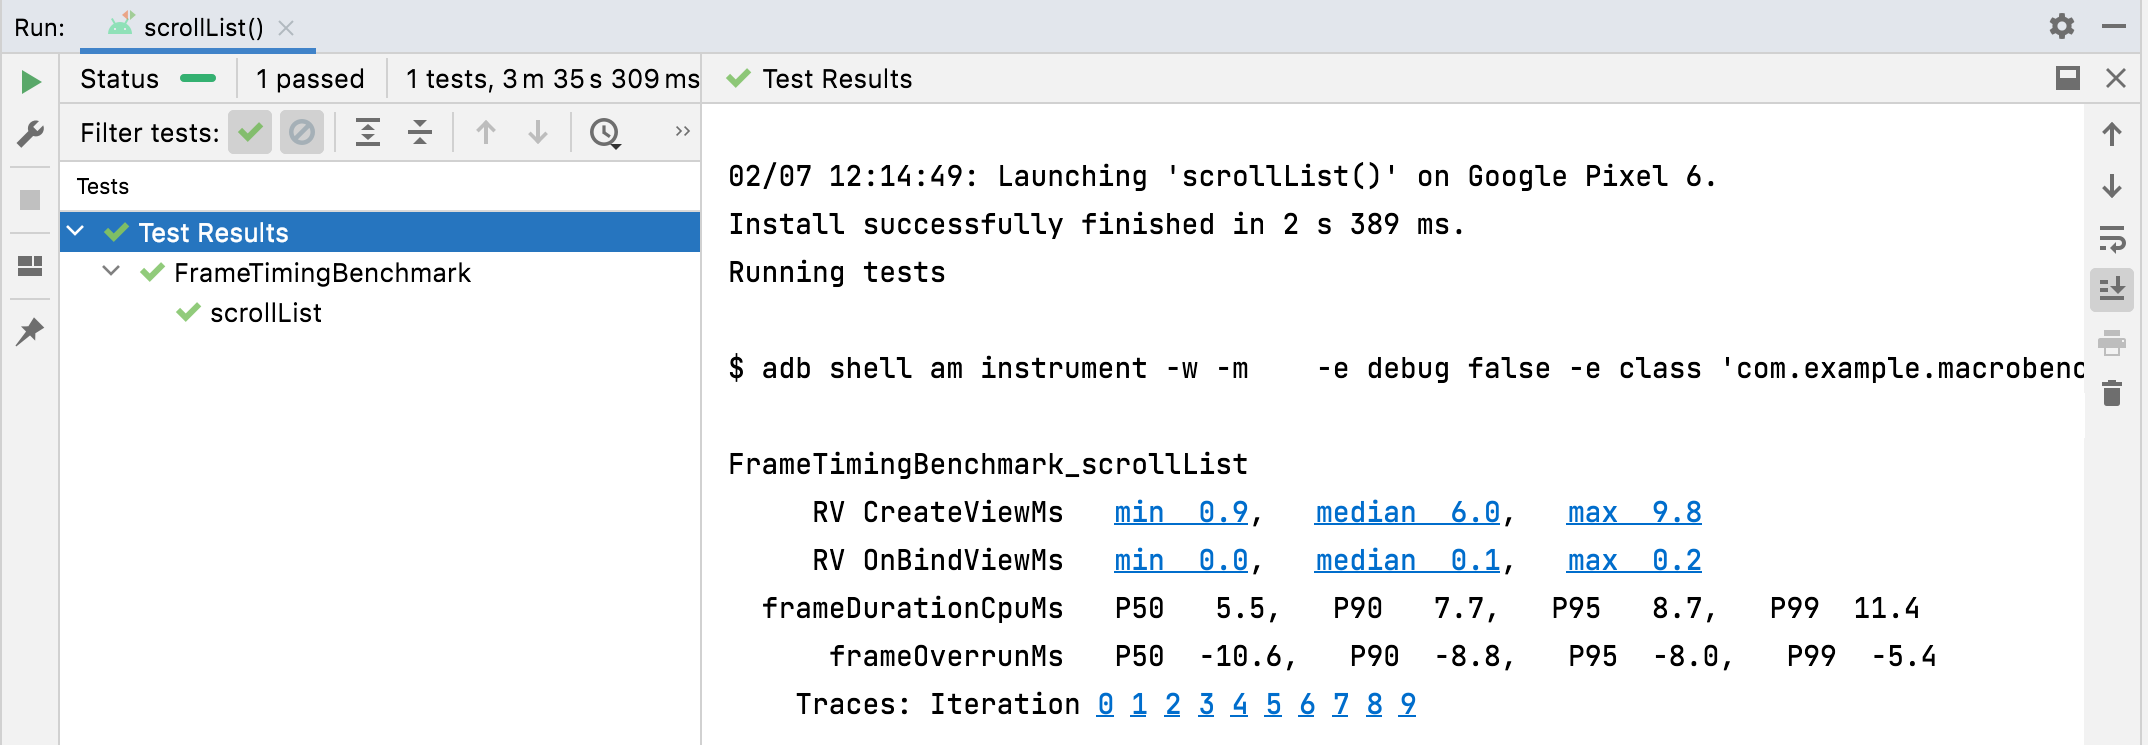
في هذا المثال، RV CreateView
وRV OnBindView
هما معرّفا الوحدات القابلة للتتبّع المحدّدة في
RecyclerView. إنّ رمز المصدر لطريقة createViewHolder()
هو مثال على كيفية تحديد كتل قابلة للتتبّع ضمن الرمز الخاص بك.
سيتم تناول StartupTimingMetric وTraceSectionMetric وFrameTimingMetric وPowerMetric بالتفصيل لاحقًا في هذا المستند.
للحصول على قائمة كاملة بالمقاييس، اطّلِع على الفئات الفرعية من Metric.
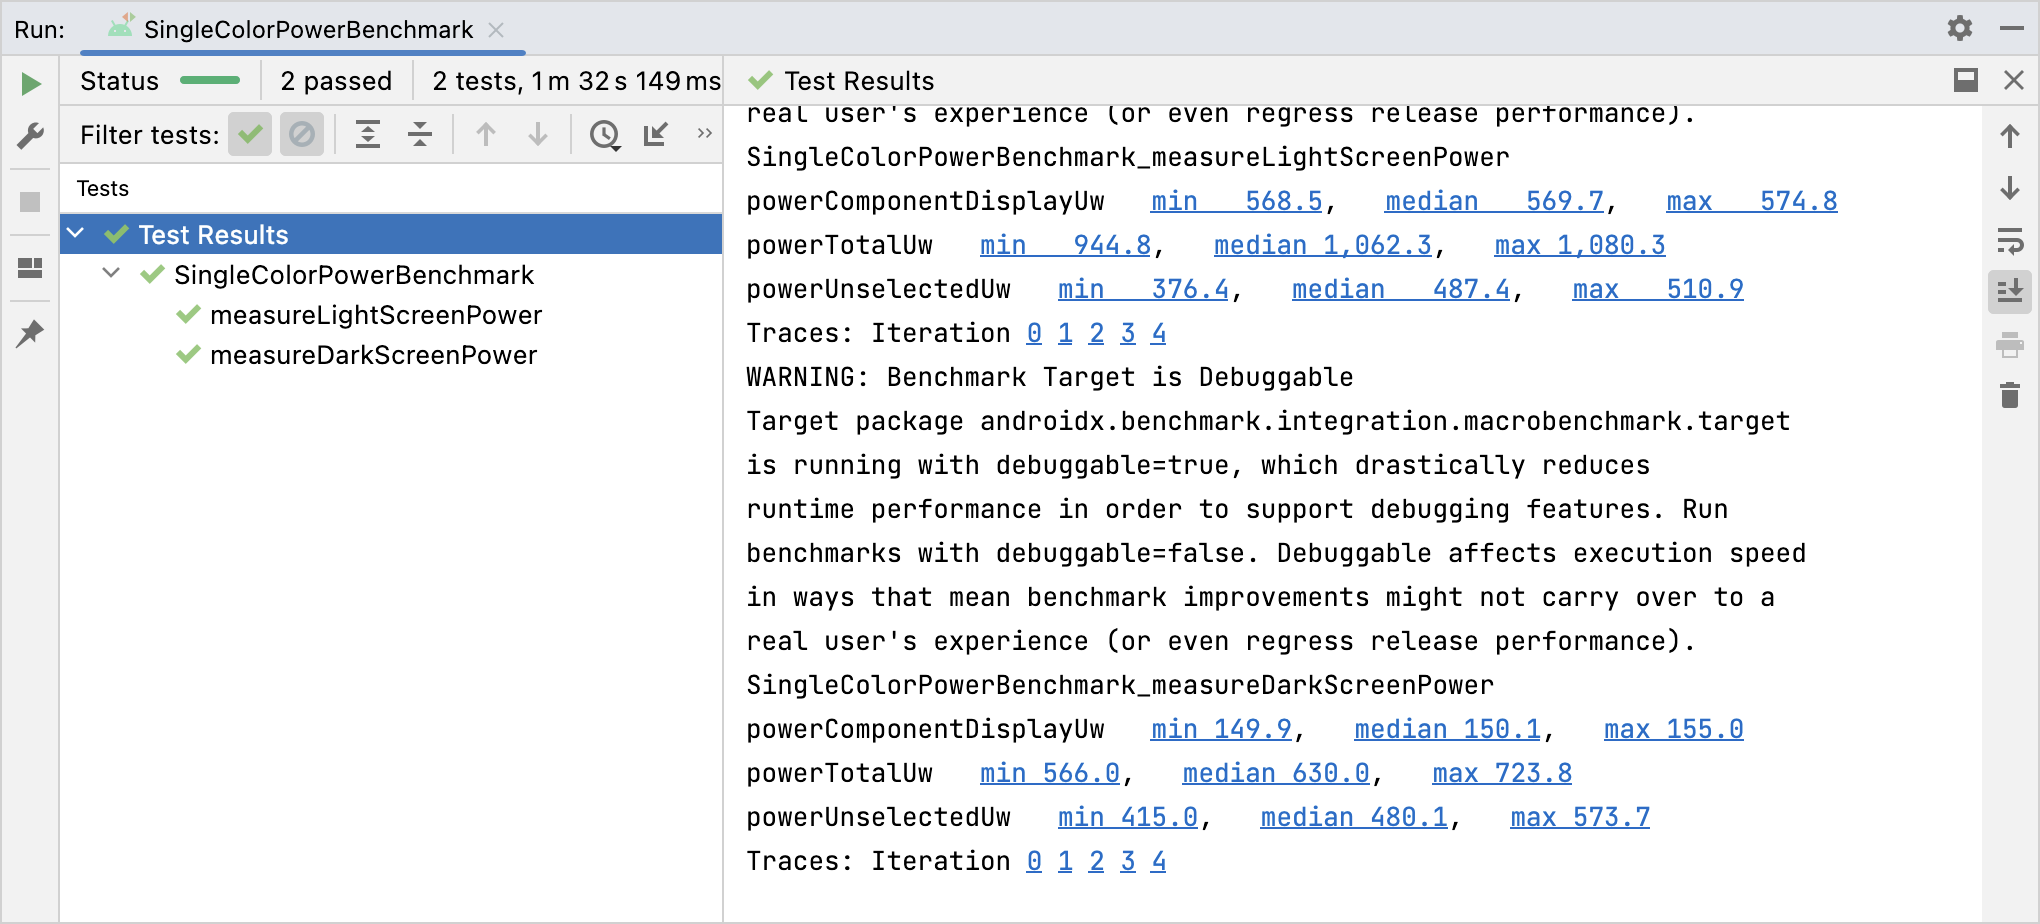
يتم إخراج نتائج قياس الأداء إلى "استوديو Android"، كما هو موضّح في الشكل 1. في حال تحديد مقاييس متعدّدة، يتم دمجها كلها في الناتج.
TraceSectionMetric وFrameTimingMetricStartupTimingMetric
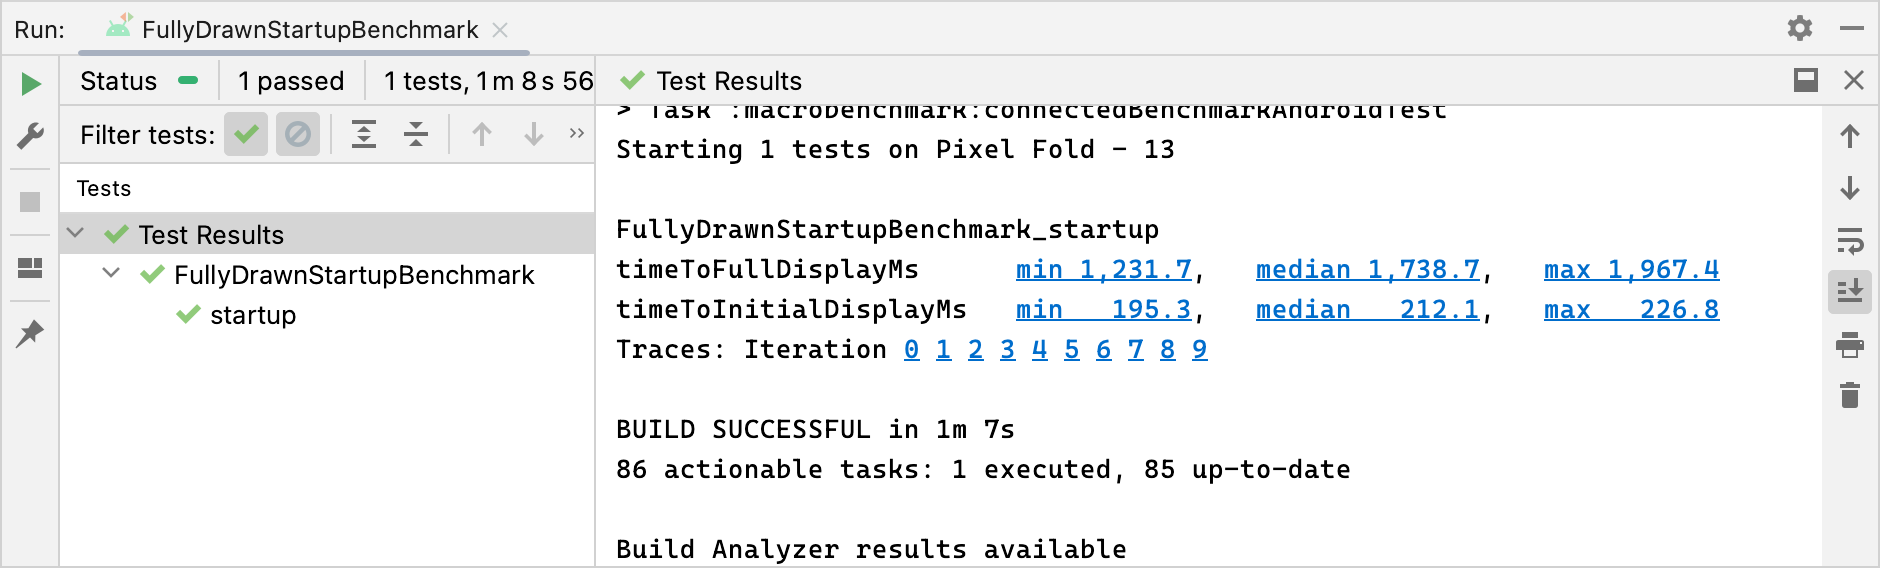
تعمل السمة StartupTimingMetric
على تسجيل مقاييس توقيت بدء تشغيل التطبيق بالقيم التالية:
timeToInitialDisplayMs: مقدار الوقت الذي يستغرقه النظام منذ تلقّي طلب تشغيل التطبيق إلى أن يعرض اللقطة الأولى منActivity.timeToFullDisplayMs: مقدار الوقت المستغرَق منذ أن يتلقّى النظام غرض تشغيل التطبيق إلى أن يبلغ التطبيق عن اكتمال عملية الرسم باستخدام طريقةreportFullyDrawn(). يتوقف القياس عند اكتمال عرض الإطار الأول بعد طلبreportFullyDrawn()أو الذي يتضمّن هذا الطلب. قد لا يتوفّر هذا المقياس على الإصدار Android 10 (المستوى 29 من واجهة برمجة التطبيقات) والإصدارات الأقدم.
تعرض StartupTimingMetric الحد الأدنى والمتوسط والأقصى للقيم من عمليات التكرار عند بدء التشغيل. لتقييم تحسّن أداء التطبيق عند بدء تشغيله، عليك التركيز على قيم المتوسط، لأنّها تقدّم أفضل تقدير لوقت بدء التشغيل المعتاد. لمزيد من المعلومات حول العوامل التي تؤثر في وقت بدء تشغيل التطبيق، يمكنك الاطّلاع على مقالة وقت بدء تشغيل التطبيق.
StartupTimingMetric نتيجةFrameTimingMetric
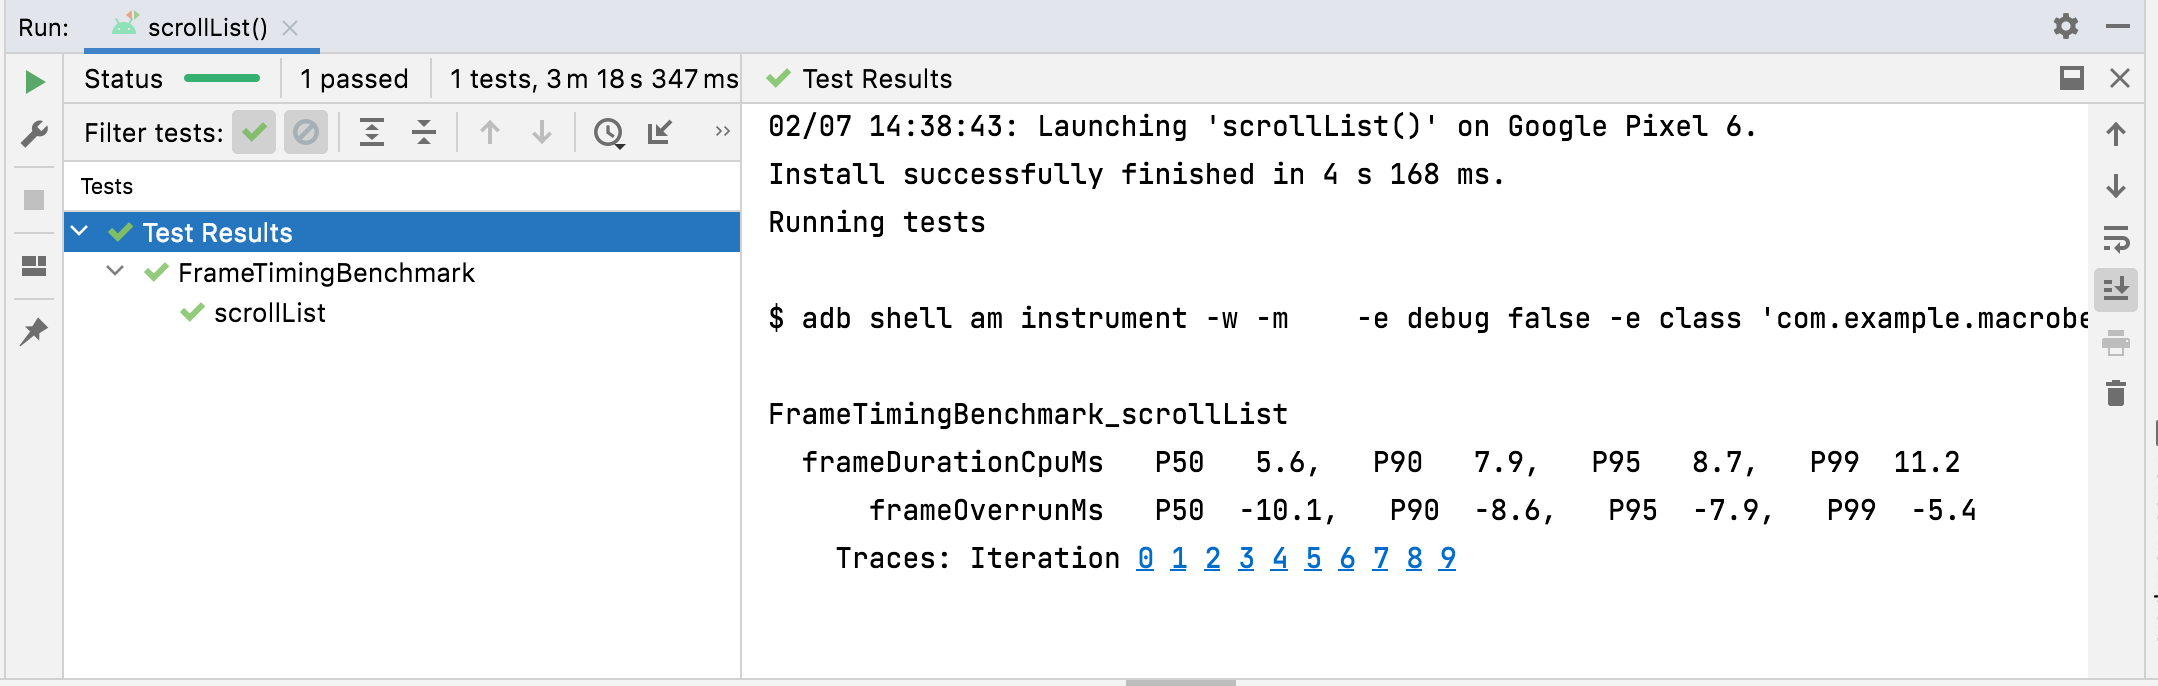
FrameTimingMetric
تسجّل معلومات التوقيت من اللقطات التي ينتجها مقياس أداء، مثل
التمرير أو الرسوم المتحركة، وتعرض القيم التالية:
frameOverrunMs: مقدار الوقت الذي تتأخر فيه لقطة معيّنة عن الموعد النهائي. تشير الأرقام الموجبة إلى حدوث انخفاض في عدد اللقطات وحدوث إيقاف مؤقت لعرض واجهة المستخدم أو تقطّع مرئي. تشير الأرقام السالبة إلى مدى سرعة عرض اللقطة مقارنةً بالموعد النهائي. ملاحظة: تتوفّر هذه الميزة فقط على الإصدار 12 من نظام التشغيل Android (مستوى واجهة برمجة التطبيقات 31) والإصدارات الأحدث.frameDurationCpuMs: مقدار الوقت الذي يستغرقه إنشاء اللقطة على وحدة المعالجة المركزية (CPU) في كل من سلسلة واجهة المستخدم وRenderThread
يتم جمع هذه القياسات في توزيع للشريحة المئوية الـ 50 والـ 90 والـ 95 والـ 99.
لمزيد من المعلومات حول كيفية تحديد اللقطات البطيئة وتحسينها، يُرجى الاطّلاع على العرض البطيء.
FrameTimingMetric نتيجةTraceSectionMetric
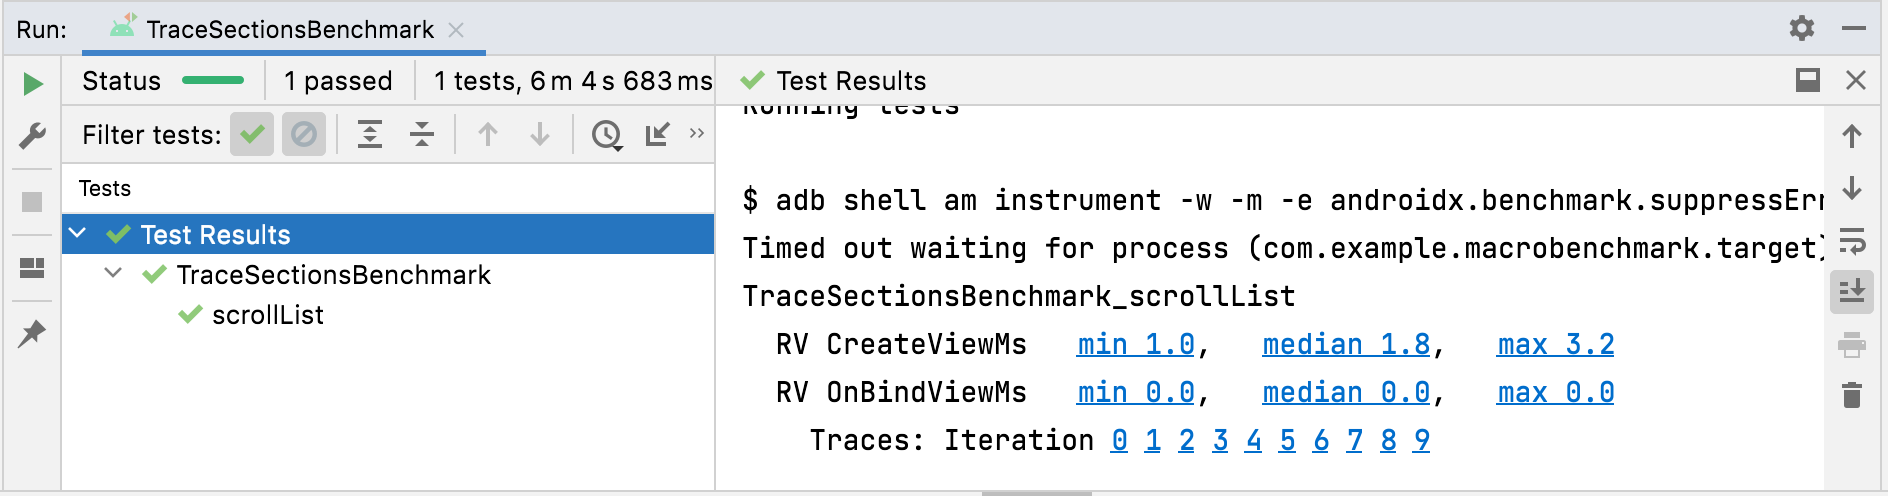
TraceSectionMetric
تسجّل عدد المرات التي يظهر فيها قسم تتبُّع مطابق sectionName
للمعلومات المقدَّمة والوقت المستغرَق. بالنسبة إلى الوقت، تعرض هذه السمة الحد الأدنى والوسيط والحد الأقصى للأوقات بالمللي ثانية. يتم تحديد قسم التتبُّع إما من خلال استدعاء الدالة trace(sectionName) أو الرمز بين Trace.beginSection(sectionName) وTrace.endSection() أو صيغها غير المتزامنة. يختار هذا المقياس دائمًا أول مثيل لجزء من عملية التتبُّع تم تسجيله أثناء عملية القياس. لا تعرض هذه السمة تلقائيًا سوى أقسام التتبُّع من حزمة التطبيق، ولتضمين العمليات خارج الحزمة، اضبط قيمة targetPackageOnly = false.
لمزيد من المعلومات حول التتبُّع، اطّلِع على نظرة عامة على تتبُّع النظام وتحديد الأحداث المخصّصة.
TraceSectionMetric نتيجةPowerMetric
تعرض PowerMetric التغيّر في الطاقة أو استهلاك الطاقة خلال مدة الاختبار لفئات الطاقة المحدّدة.
يتم تقسيم كل فئة محدّدة إلى مكوناتها الفرعية القابلة للقياس، وتتم إضافة الفئات غير المحدّدة إلى مقياس "غير محدّد".
تقيس هذه المقاييس الاستهلاك على مستوى النظام، وليس الاستهلاك على أساس كل تطبيق، وهي تقتصر على هواتف Pixel 6 وPixel 6 Pro والإصدارات الأحدث:
-
power<category>Uw: مقدار الطاقة المستهلكة خلال مدة الاختبار في هذه الفئة energy<category>Uws: كمية الطاقة المنقولة لكل وحدة زمنية خلال مدة الاختبار في هذه الفئة
تشمل الفئات ما يلي:
CPUDISPLAYGPUGPSMEMORYMACHINE_LEARNINGNETWORKUNCATEGORIZED
في بعض الفئات، مثل CPU، قد يكون من الصعب فصل العمليات التي تنفّذها تطبيقات أخرى عن العمليات التي ينفّذها تطبيقك. ولتقليل التداخل، عليك إزالة التطبيقات والحسابات غير الضرورية أو حظرها.
PowerMetric نتيجةمُقترَحة لك
- ملاحظة: يتم عرض نص الرابط عندما تكون JavaScript غير مفعّلة.
- إنشاء ملفات تعريف أساسية {:#creating-profile-rules}
- كتابة Macrobenchmark
- تحليل عملية بدء تشغيل التطبيق وتحسينها {:#app-startup-analysis-optimization}