
기준 프로필을 사용 설정한 경우 Jetpack Macrobenchmark를 사용하여 앱의 성능을 테스트한 후 그 결과를 기준 프로필을 사용하지 않은 벤치마크와 비교하는 것을 권장합니다. 이 접근 방식을 사용하면 앱 시작 시간(처음 표시하는 데 걸린 시간과 완전히 표시하는 데 걸린 시간 모두)이나 런타임 렌더링 성능을 측정하여, 생성된 프레임으로 인해 버벅거림이 발생할 수 있는지 확인할 수 있습니다.
Macrobenchmark를 사용하면 CompilationMode API를 통해 측정 전 컴파일을 제어할 수 있습니다. 다양한 CompilationMode 값을 사용하여 다양한 컴파일 상태의 성능을 비교합니다. 다음 코드 스니펫은 CompilationMode 매개변수를 사용하여 기준 프로필의 이점을 측정하는 방법을 보여줍니다.
@RunWith(AndroidJUnit4ClassRunner::class)
class ColdStartupBenchmark {
    @get:Rule
    val benchmarkRule = MacrobenchmarkRule()

    // No ahead-of-time (AOT) compilation at all. Represents performance of a
    // fresh install on a user's device if you don't enable Baseline Profiles—
    // generally the worst case performance.
    @Test
    fun startupNoCompilation() = startup(CompilationMode.None())

    // Partial pre-compilation with Baseline Profiles. Represents performance of
    // a fresh install on a user's device.
    @Test
    fun startupPartialWithBaselineProfiles() =
        startup(CompilationMode.Partial(baselineProfileMode = BaselineProfileMode.Require))

    // Partial pre-compilation with some just-in-time (JIT) compilation.
    // Represents performance after some app usage.
    @Test
    fun startupPartialCompilation() = startup(
        CompilationMode.Partial(
            baselineProfileMode = BaselineProfileMode.Disable,
            warmupIteration = 3
        )
    )

    // Full pre-compilation. Generally not representative of real user
    // experience, but can yield more stable performance metrics by removing
    // noise from JIT compilation within benchmark runs.
    @Test
    fun startupFullCompilation() = startup(CompilationMode.Full())

    private fun startup(compilationMode: CompilationMode) = benchmarkRule.measureRepeated(
        packageName = "com.example.macrobenchmark.target",
        metrics = listOf(StartupTimingMetric()),
        compilationMode = compilationMode,
        iterations = 10,
        startupMode = StartupMode.COLD,
        setupBlock = {
            pressHome()
        }
    ) {
        uiAutomator {
            startApp(packageName)
            onElement(5_000) { viewIdResourceName == "my-content"}
        }
    }
}
다음 스크린샷에서는 Google Pixel 7에서 실행된 Now in Android 샘플 앱의 결과를 Android 스튜디오에서 직접 확인할 수 있습니다. 결과에 따르면 컴파일하지 않은 것(324.8밀리초)과 대조적으로 기준 프로필을 사용할 때(229.0밀리초) 앱 시작이 가장 빠른 것을 확인할 수 있습니다.
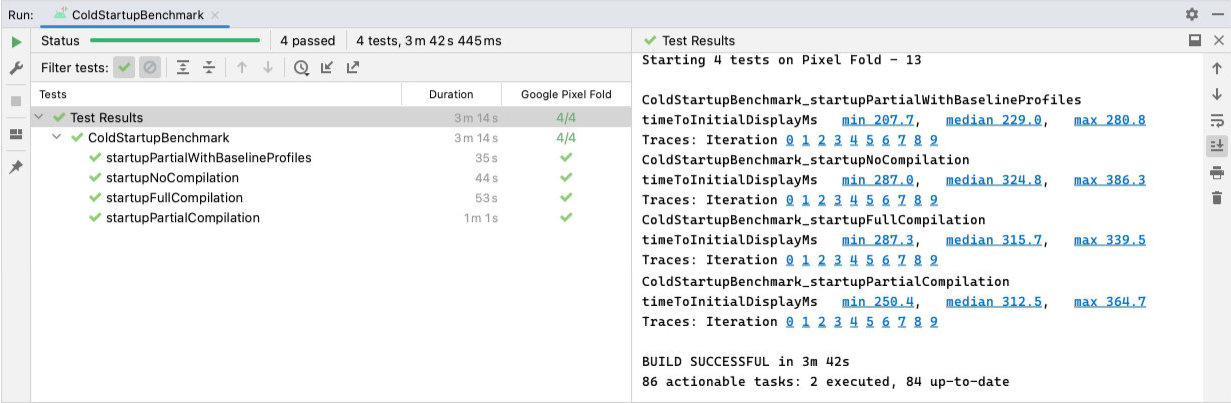
ColdStartupBenchmark 결과. 컴파일하지 않은 경우 324밀리초, 전체 컴파일한 경우 315밀리초, 부분 컴파일한 경우 312밀리초, 기준 프로필을 사용한 경우 229밀리초이전 예에서는 StartupTimingMetric으로 캡처된 앱 시작 결과를 보여주지만 FrameTimingMetric과 같은 다른 중요한 측정항목도 고려해야 합니다. 모든 유형의 측정항목에 관한 자세한 내용은 Macrobenchmark 측정항목 캡처를 참고하세요.
완전히 표시하는 데 걸린 시간
이전 예에서는 앱이 첫 번째 프레임을 생성하는 데 걸린 시간인 처음 표시하는 데 걸린 시간(TTID)을 측정합니다. 그러나 여기에는 사용자가 앱과 상호작용을 시작할 수 있는 시간이 꼭 반영되는 것은 아닙니다. 완전히 표시하는 데 걸린 시간(TTFD) 측정항목은 완전히 사용할 수 있는 앱 상태를 유지하는 데 필요한 코드 경로를 측정하고 최적화하는 데 더 유용합니다.
TTID와 TTFD는 둘 다 중요하므로 모두 최적화하는 것이 좋습니다. TTID가 낮으면 사용자가 앱이 실제로 실행되고 있는지 직접 확인할 수 있습니다. 사용자가 앱과 빠르게 상호작용할 수 있도록 하려면 TTFD를 짧게 유지하는 것이 중요합니다.
앱 UI가 완전히 그려진 시점을 보고하는 전략은 시작 시간 정확성 개선을 참고하세요.
추천 서비스
- 참고: JavaScript가 사용 중지되어 있으면 링크 텍스트가 표시됩니다.
- [Macrobenchmark 작성][11]
- [Macrobenchmark 측정항목 캡처][12]
- UI Automator를 사용하여 자동 테스트 작성
- [앱 시작 분석 및 최적화{:#app-startup-analysis-optimization}][14]