
Cette page présente les nouvelles fonctionnalités introduites dans les versions Preview d'Android Studio. Les versions Preview offrent un accès anticipé aux dernières fonctionnalités et améliorations d'Android Studio. Vous pouvez télécharger ces versions d'aperçu. Si vous rencontrez des problèmes lors de l'utilisation d'une version preview d'Android Studio, contactez-nous. Vos rapports de bug nous aident à améliorer Android Studio.
Les versions Canary contiennent des fonctionnalités de pointe en cours de développement et sont testées de manière superficielle. Vous pouvez utiliser les versions Canary pour le développement, mais sachez que des fonctionnalités peuvent être ajoutées ou modifiées. Les versions candidates (RC) sont la prochaine version d'Android Studio et sont presque prêtes à être publiées en version stable. L'ensemble de fonctionnalités de la prochaine version a été stabilisé. Consultez Noms des versions d'Android Studio pour comprendre la dénomination des versions d'Android Studio.
Pour obtenir les dernières actualités sur les versions preview d'Android Studio, y compris une liste des correctifs notables dans chaque version preview, consultez les mises à jour des versions sur le blog Android Studio.
Versions actuelles d'Android Studio
Le tableau suivant répertorie les versions actuelles d'Android Studio et leurs canaux respectifs.
| Version | Chaîne |
|---|---|
| Android Studio Quail 2 | Stable |
| Plug-in Android Gradle 9.3.0 | Stable |
| Android Studio Quail 3 | CR |
| Android Studio Quail 4 | Canary |
Compatibilité avec les aperçus du plug-in Android Gradle
Chaque version preview d'Android Studio est publiée avec une version correspondante du plug-in Android Gradle (AGP). Les versions preview de Studio devraient fonctionner avec n'importe quelle version stable compatible d'AGP. Toutefois, si vous utilisez une version preview d'AGP, vous devez utiliser la version preview correspondante de Studio (par exemple, Android Studio Chipmunk Canary 7 avec AGP 7.2.0-alpha07). Toute tentative d'utilisation de versions divergentes (par exemple, Android Studio Chipmunk bêta 1 avec AGP 7.2.0-alpha07) entraînera un échec de la synchronisation, ce qui vous invitera à passer à la version correspondante d'AGP.
Pour obtenir un journal détaillé des arrêts et suppressions de l'API du plug-in Android Gradle, consultez les mises à jour de l'API du plug-in Android Gradle.
Studio Labs
Studio Labs vous permet de tester les dernières fonctionnalités expérimentales d'IA dans une version stable d'Android Studio. Vous pouvez ainsi intégrer plus rapidement nos offres d'assistance par IA dans votre workflow de développement. Pour en savoir plus, consultez Studio Labs.
Voici les fonctionnalités actuellement disponibles dans Studio Labs.
| Fonctionnalité | Description | Docs |
|---|---|---|
| Parcours pour Android Studio | Utilisez le langage naturel pour décrire les étapes et les assertions des tests de bout en bout. | Journeys for Android Studio |
Android Studio Quail 3
Android Studio Quail 3 inclut plusieurs corrections de bugs et améliorations.
Pour voir les corrections apportées à cette version d'Android Studio, consultez les problèmes résolus.
Android Studio Quail 4
Voici les nouvelles fonctionnalités d'Android Studio Quail 4 :
Pour voir les corrections apportées à cette version d'Android Studio, consultez les problèmes résolus.
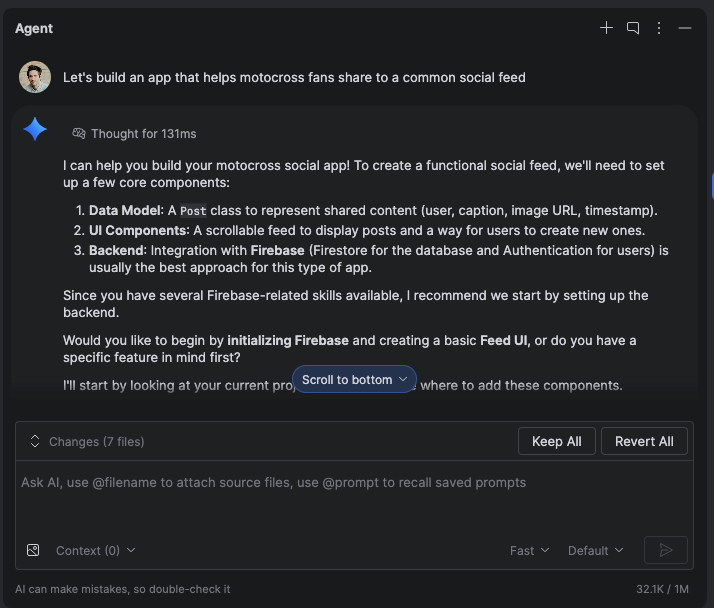
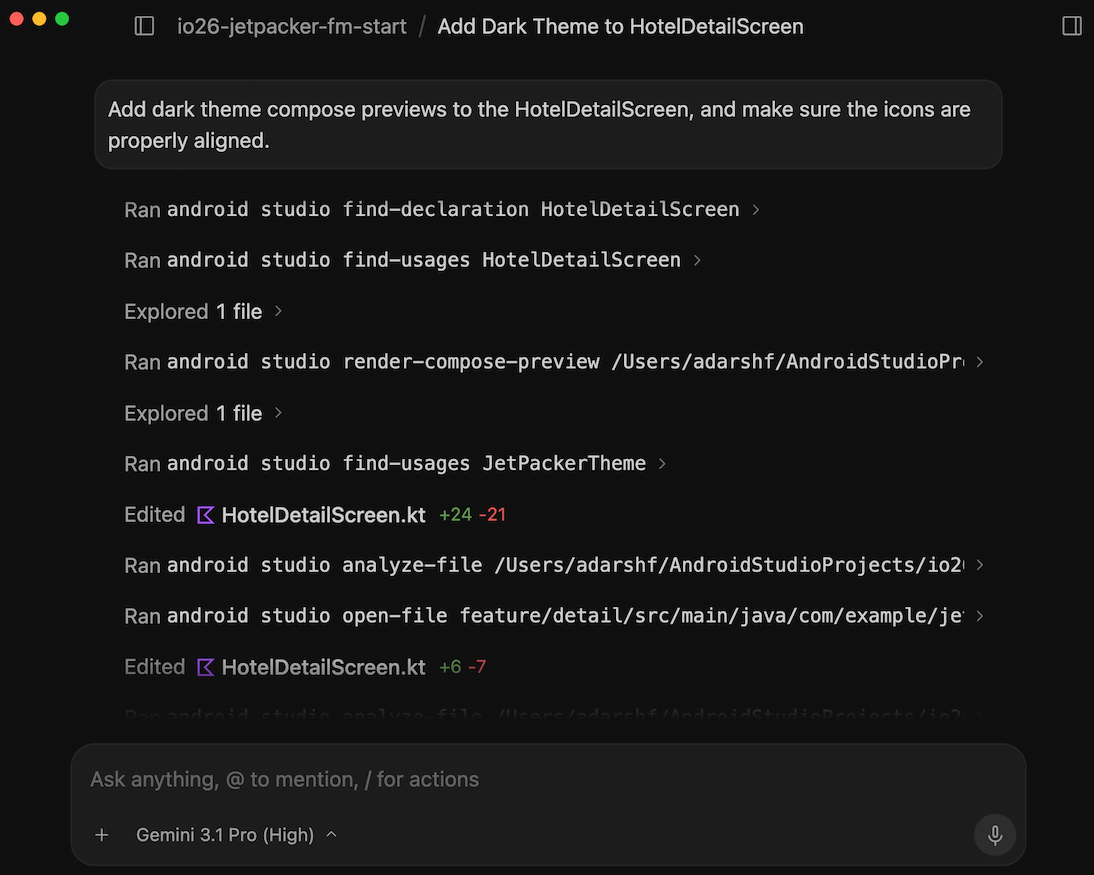
Créer des applications full stack avec Firebase en mode Agent
Les services Firebase tels que les bases de données Authentication et Cloud Firestore peuvent être activés et configurés directement en mode Agent dans Android Studio à l'aide des compétences de l'agent Firebase. L'agent peut vous aider à effectuer l'intégration de Firebase et à configurer les services de backend. Cette intégration vous permet de créer des applications Android robustes et complètes sans quitter votre IDE.
Plus de possibilités lors de la création d'un projet avec l'IA
La possibilité de créer des projets avec l'IA est devenue un outil de développement complet : il utilise un plan d'exécution en plusieurs étapes et une "boucle de génération" autonome qui peut configurer automatiquement les dépendances dans plusieurs fichiers et corriger automatiquement les erreurs de compilation lors de la configuration du projet.
Cette fonctionnalité est encore améliorée par son intégration aux compétences de l'agent Firebase, qui vous permet de créer, de déboguer et de déployer des applications full stack complètes à partir d'un seul prompt.
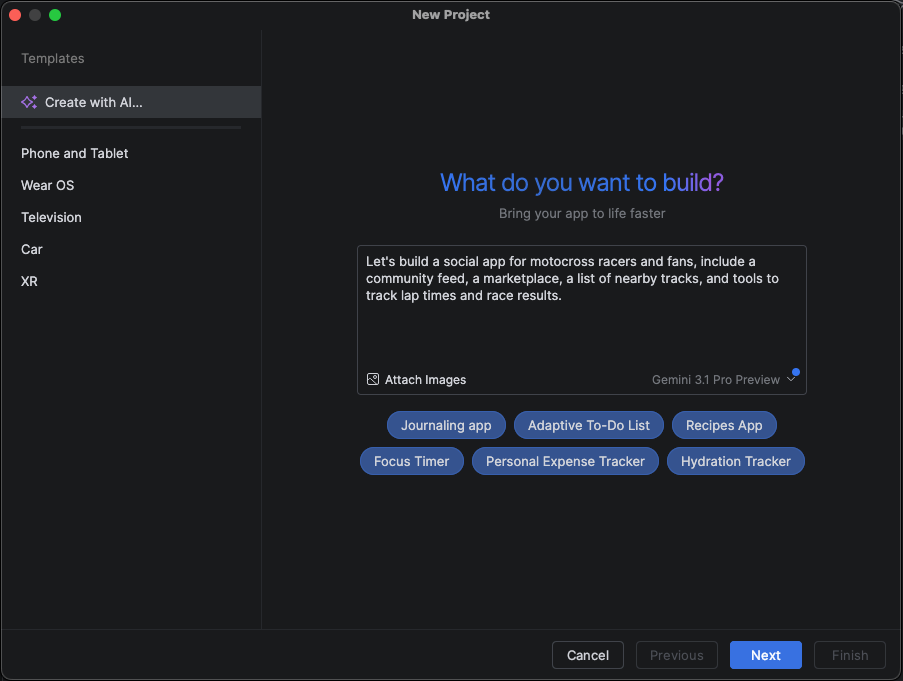
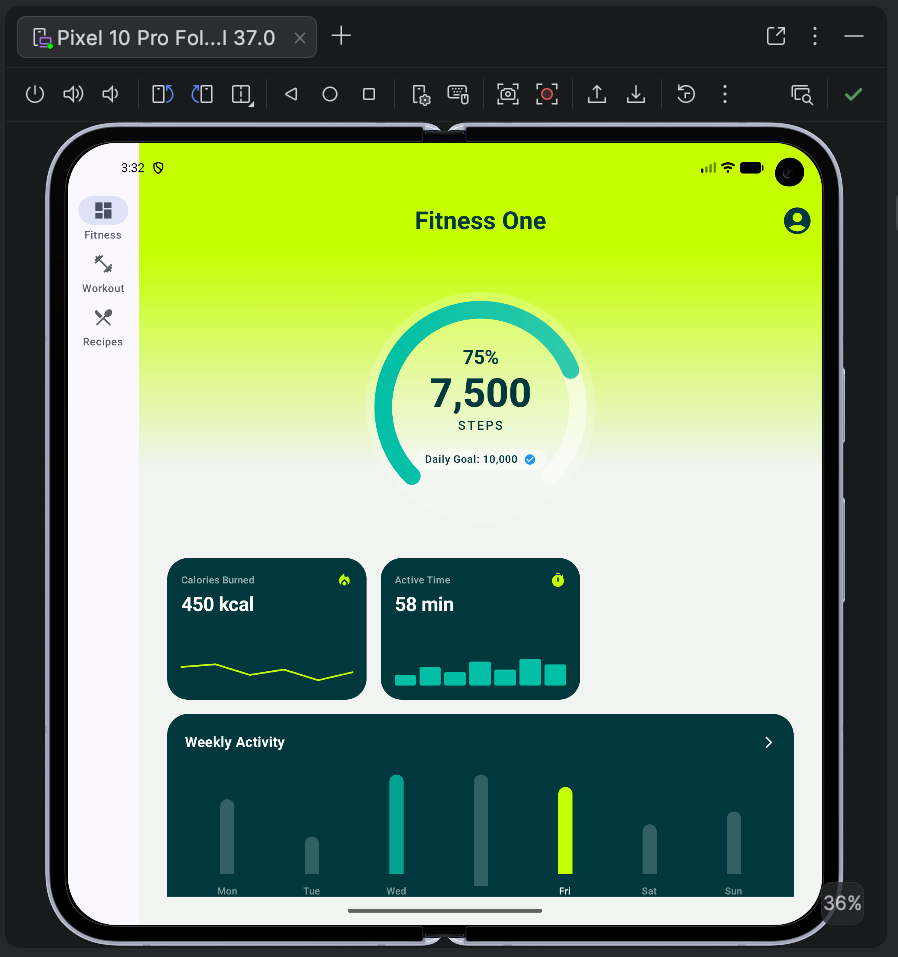
De plus, le workflow de création de projets assisté par l'IA est compatible avec les optimisations pour les grands écrans. Vous pouvez spécifier que vous souhaitez que votre projet soit structuré avec des mises en page, une navigation et des composants optimisés pour les tablettes, les appareils pliables et les appareils à grand écran. L'agent d'Android Studio peut également configurer et lancer des émulateurs grand écran pour tester immédiatement votre nouvelle mise en page.
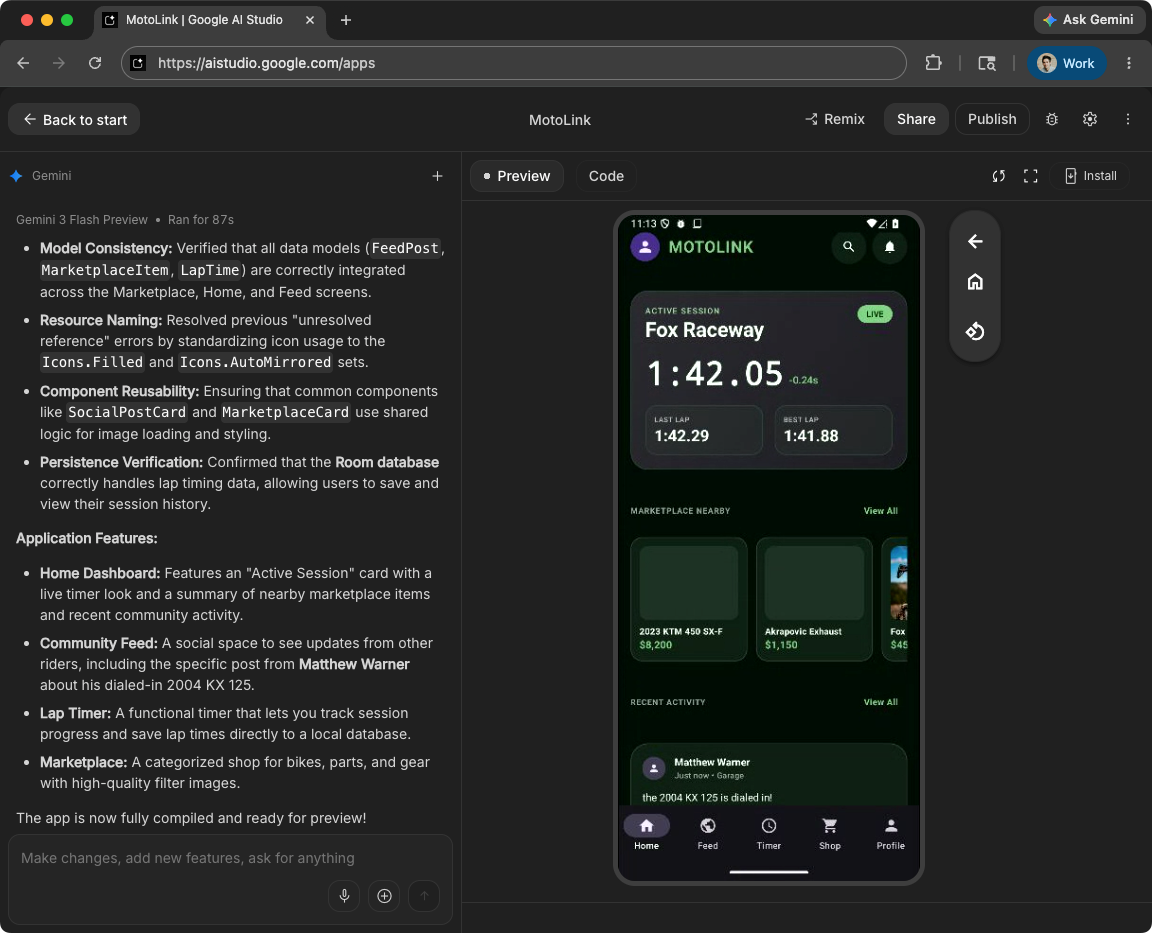
Créer des applications Android dans Google AI Studio
Google AI Studio est compatible avec les fonctionnalités de développement d'applications Android complètes. Vous pouvez générer de nouvelles applications Android à partir de requêtes en langage naturel, les prévisualiser instantanément à l'aide d'un émulateur Android intégré et les déployer directement sur vos appareils physiques via USB à l'aide d'ADB.
Lorsque vous êtes prêt à effectuer des tests auprès d'utilisateurs, Google AI Studio peut publier directement sur la Google Play Console. L'outil gère automatiquement la création de l'enregistrement de l'application, regroupe le package et l'importe sur un canal de test interne.
Pour des modifications avancées et une production prête à l'emploi, vous pouvez exporter votre projet Google AI Studio sous forme de fichier ZIP et l'ouvrir facilement dans Android Studio.
CLI Android
Android CLI vous permet de créer des applications à l'aide de l'agent d'IA, du LLM ou de l'environnement de développement de votre choix. Il est conçu pour aider les agents d'IA à créer plus rapidement et à utiliser moins de jetons que les outils LLM génériques.
Vous pouvez ancrer votre agent avec la base de connaissances Android et les compétences Android pour vous assurer qu'il suit les bonnes pratiques recommandées. De plus, Android CLI permet à votre agent d'appeler l'IDE pour effectuer des tâches avancées, comme rechercher des déclarations de symboles et analyser les fichiers pour détecter les problèmes.
De plus, l'interface de ligne de commande Android est intégrée à Google Antigravity 2.0.
Outil de test de captures d'écran de l'aperçu Compose
Utilisez l'outil de test de capture d'écran de prévisualisation Compose pour tester vos interfaces utilisateur Compose et éviter les régressions. Ce nouvel outil vous aide à générer des rapports HTML qui vous permettent de détecter visuellement les modifications apportées à l'UI de votre application. Pour en savoir plus, consultez Compose Preview Screenshot Testing.
Lectures de l'état de recomposition dans l'outil d'inspection de la mise en page
Nous avons facilité le diagnostic des nombres de recomposition élevés en ajoutant des lectures d'état de recomposition à l'outil d'inspection de la mise en page. Disponible dans Panda 3 Canary, cette fonctionnalité vous aide à identifier les variables d'état qui ont déclenché une recomposition en fournissant une liste détaillée des lectures d'état effectuées au cours de ce cycle. Pour utiliser cette fonctionnalité, utilisez compose.ui:ui:1.10.0 (BOM 2025.12.01) ou une version ultérieure.
Fonctionnalités clés
Voici les principales fonctionnalités de cette option :
- Invalidation de l'état de la trace : lorsqu'un nœud se recompose, cliquez sur le lien du nombre de recompositions dans l'arborescence des composants pour ouvrir le panneau d'inspection de l'état.
- Traces de pile détaillées : identifiez les variables d'état spécifiques en cours de lecture, y compris sous forme de nombres, de listes ou de valeurs d'altitude. Vérifiez lesquels ont été
invalidated(modifiés) pour déclencher la mise à jour. - Parcourir l'historique des recompositions : utilisez les flèches de navigation dans l'en-tête du panneau pour parcourir les données d'état des recompositions précédentes pour un nœud spécifique.
- Explications optimisées par l'IA : cliquez sur Expliquer avec l'IA dans le panneau "Inspection de l'état" pour afficher une explication en langage naturel de l'état lu et de la raison pour laquelle il a entraîné une recomposition.
Commencer
Pour tester ces fonctionnalités, procédez comme suit.
- Ouvrez l'outil d'inspection de la mise en page.
Faites un clic droit sur la colonne de recomposition, puis effectuez l'une des opérations suivantes :
- Pour tous les nœuds, sélectionnez Observer la recomposition > Observer tout.
- Pour des notes spécifiques, sélectionnez Recomposition > Observer le nœud.
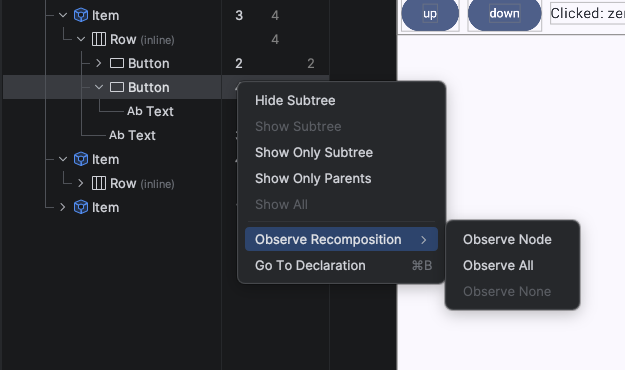
Activez les lectures d'état de recomposition dans l'outil d'inspection de la mise en page. Interagissez avec votre application. Lorsque des recompositions se produisent, cliquez sur les liens de nombre bleus dans l'arborescence des composants pour inspecter l'état.
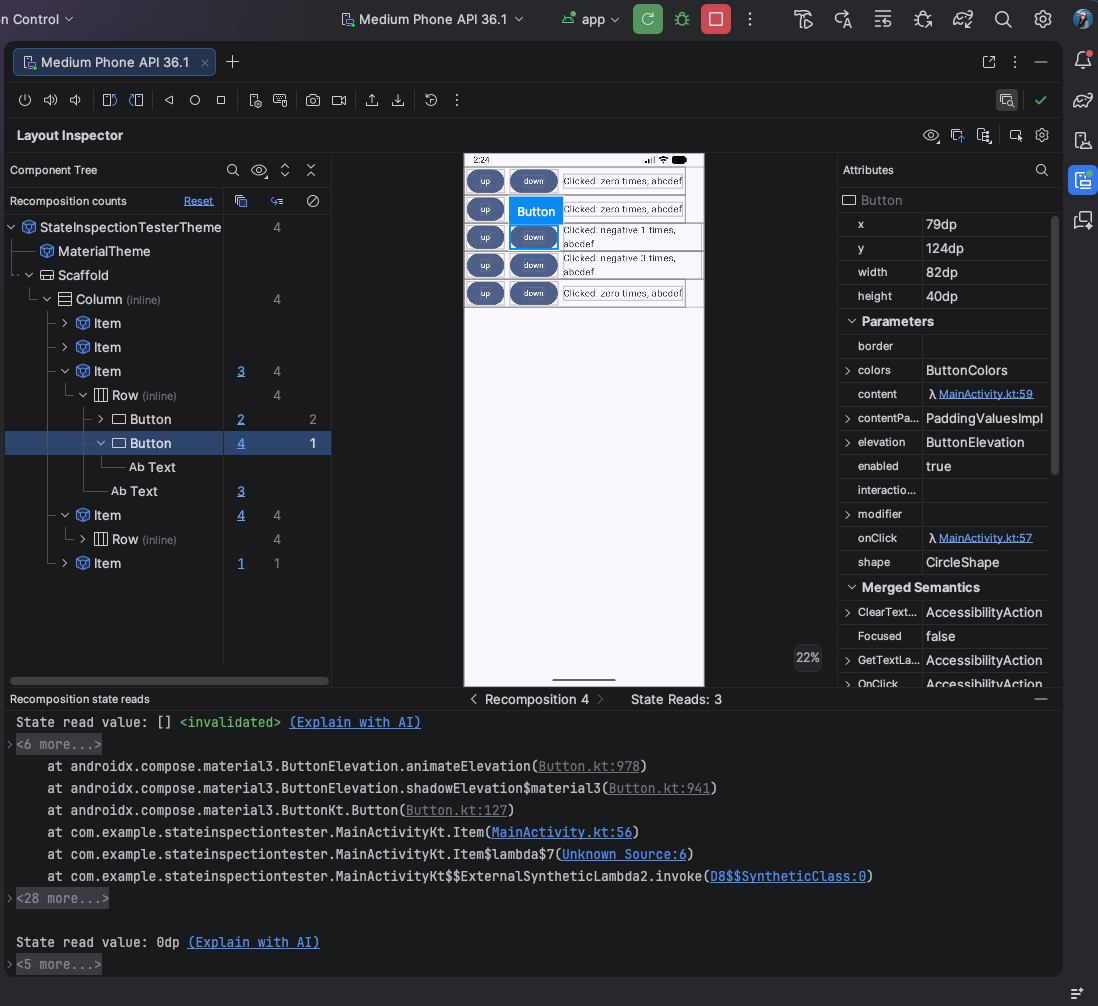
Exemple de résultat des lectures de l'état de recomposition dans l'outil d'inspection de la mise en page Cliquez sur "Expliquer avec l'IA" pour obtenir une analyse détaillée des raisons de la recomposition.
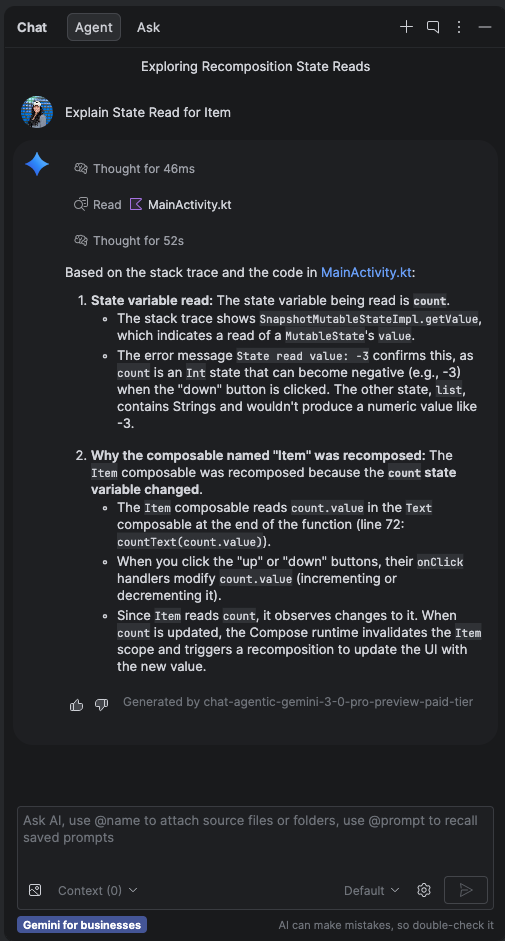
Exemple de résultat de "Expliquer avec l'IA" pour les lectures d'état dans l'outil d'inspection de la mise en page
Publier sur Google Play pour les tests
Android Studio vous permet désormais d'importer de nouvelles versions de votre application directement dans les canaux de test de la Google Play Console. Pour ce faire, sélectionnez une nouvelle option pour continuer à "Publier pour les tests" à la fin du flux "Générer un Android App Bundle signé". Cette intégration permet d'importer une version initiale d'une toute nouvelle application dans un canal de test interne de la Play Console. Vous pouvez également utiliser cette fonctionnalité pour importer des versions d'applications existantes vers d'autres types de canaux de test. Pour profiter de cette fonctionnalité, vous devez être inscrit à la Google Play Console.