
Use the Build Analyzer to inspect the build performance of your project. For each build you perform, the Build Analyzer tries to present the most important information so that you can quickly identify and resolve regressions in your build performance.
For additional strategies on improving build performance, read Optimize your build speed.
Get started
Each time you build your app, the Build Analyzer creates a report and displays data from the latest report in the Build window.
To get started, proceed as follows:
- If you haven't already done so, build your app in one of the following ways:
- Click Build > Make Project from the menu bar.
- To build an Android App Bundle or APK, click Build > Build Bundle(s) / APK(s) > Build Bundle(s) or Build > Build Bundle(s) / APK(s) > Build APK(s) from the menu bar.
- To open the Build window, select View > Tool Windows > Build from the menu bar.
- To view the build report in the Build Analyzer, click the Build Analyzer tab in the Build window.
The data that the Build Analyzer presents might change across builds, so it's helpful to build your project multiple times and compare the data to identify patterns.
View plugins with tasks determining the build's duration
When you first open the Build Analyzer after completing a build, the window displays an overview of the build analysis, as shown in figure 1.
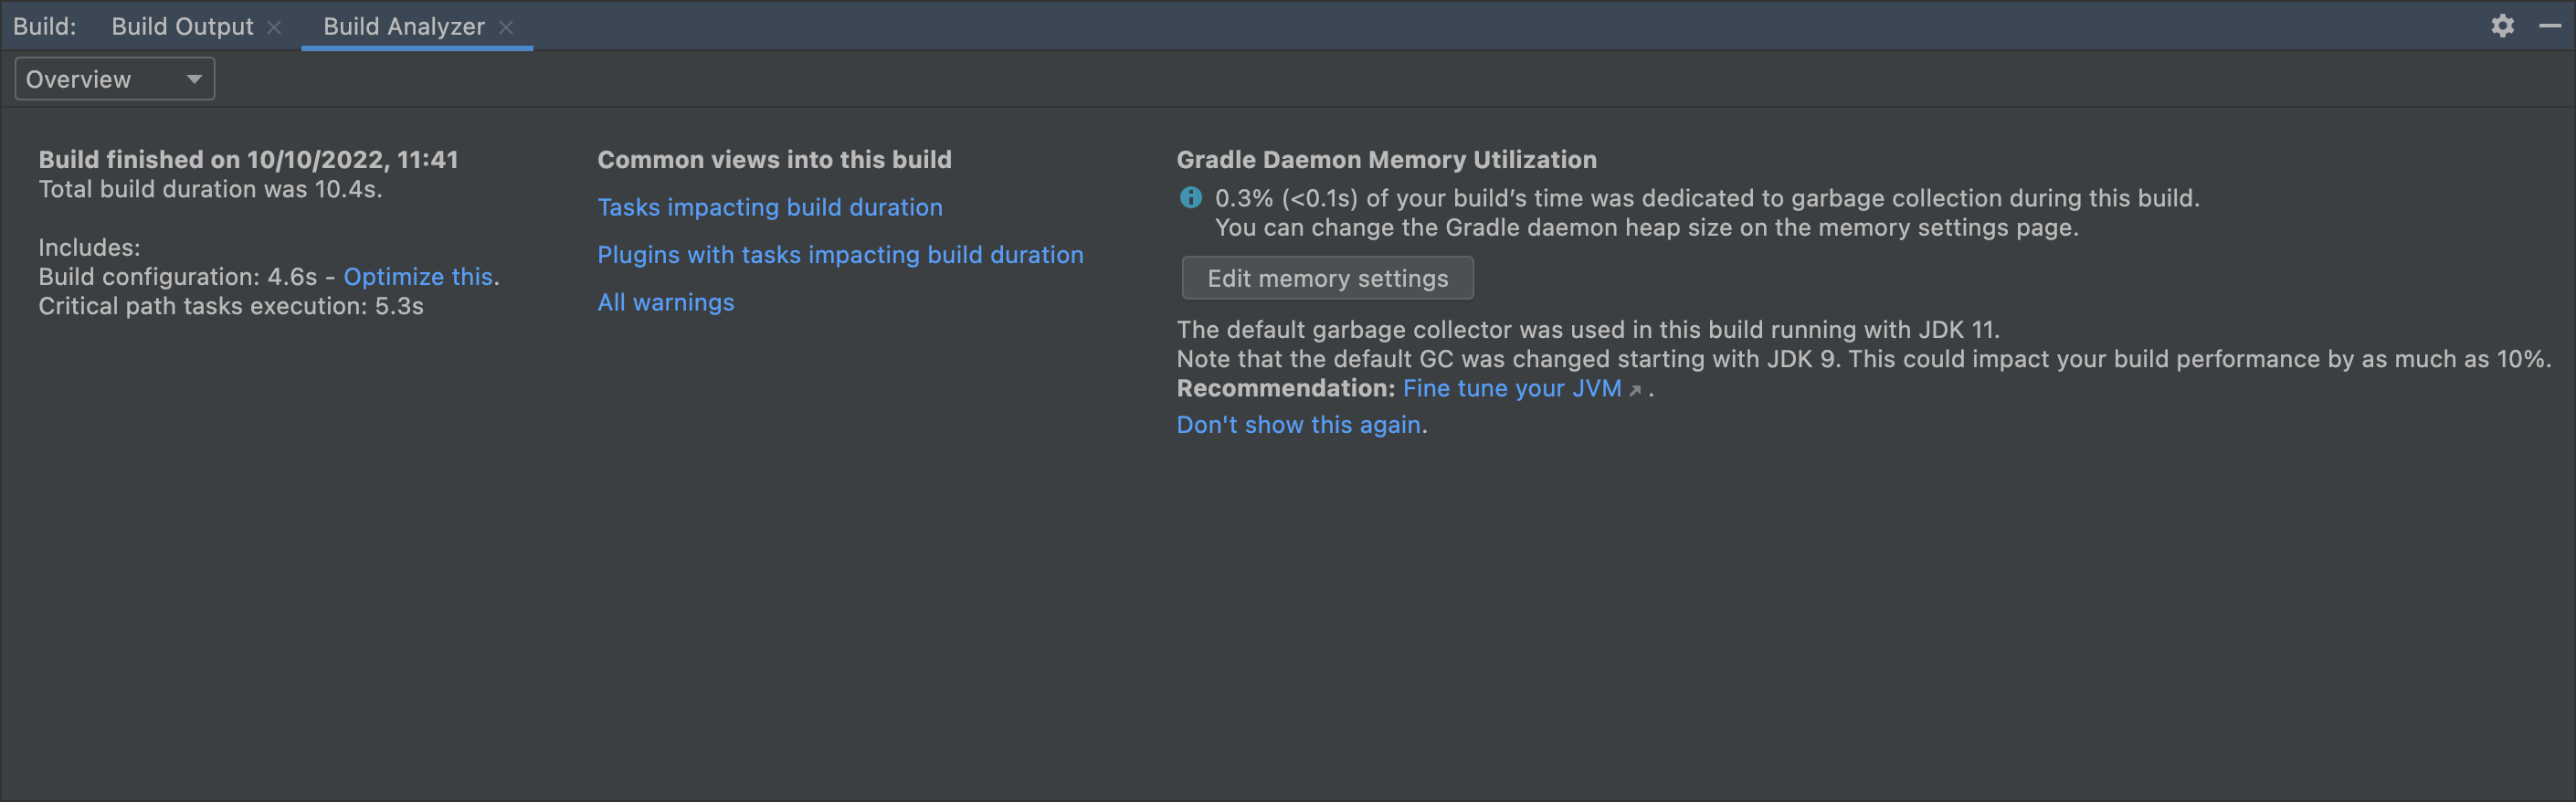
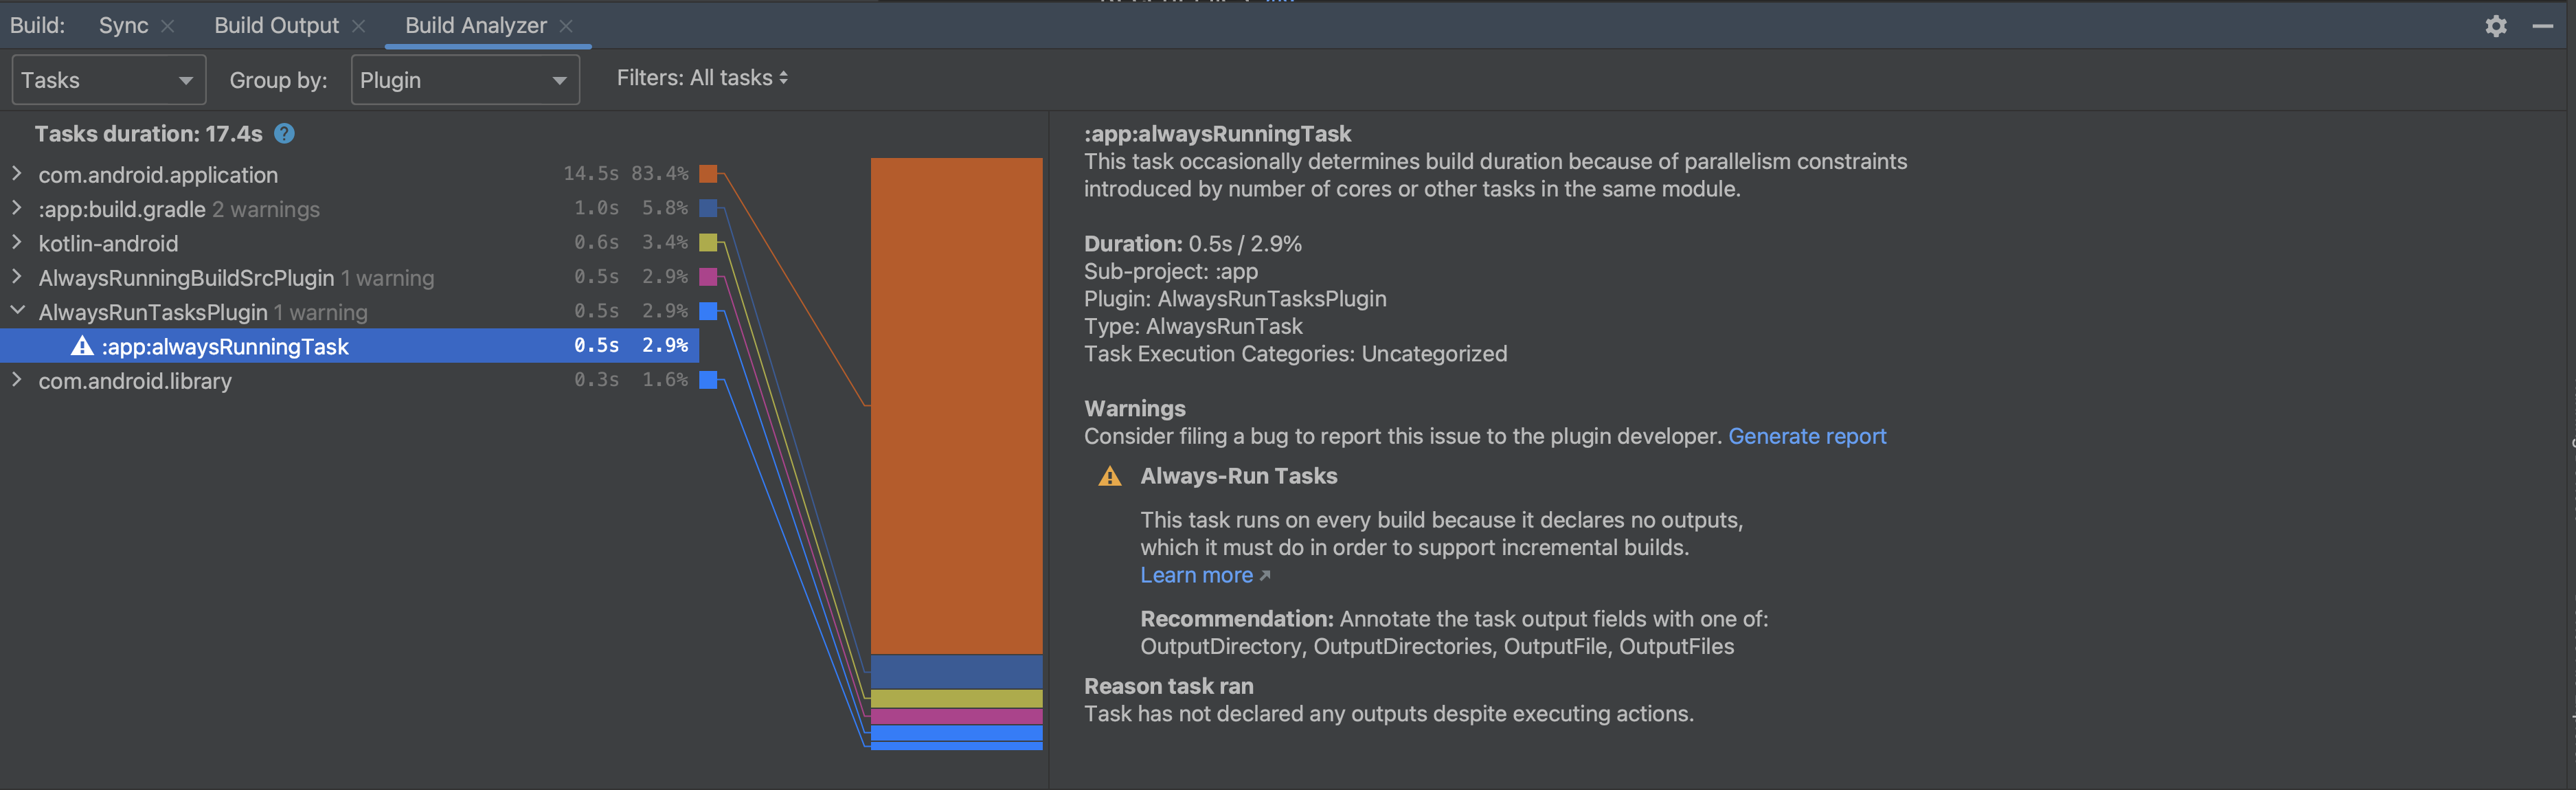
To see a breakdown of plugins with tasks determining the build's duration, click Plugins with tasks impacting build duration on the overview page. You can also select Tasks from the dropdown and confirm that you're grouping by plugin. The graph orders the plugins and their related tasks by the total time they take to complete.
View tasks determining the build's duration
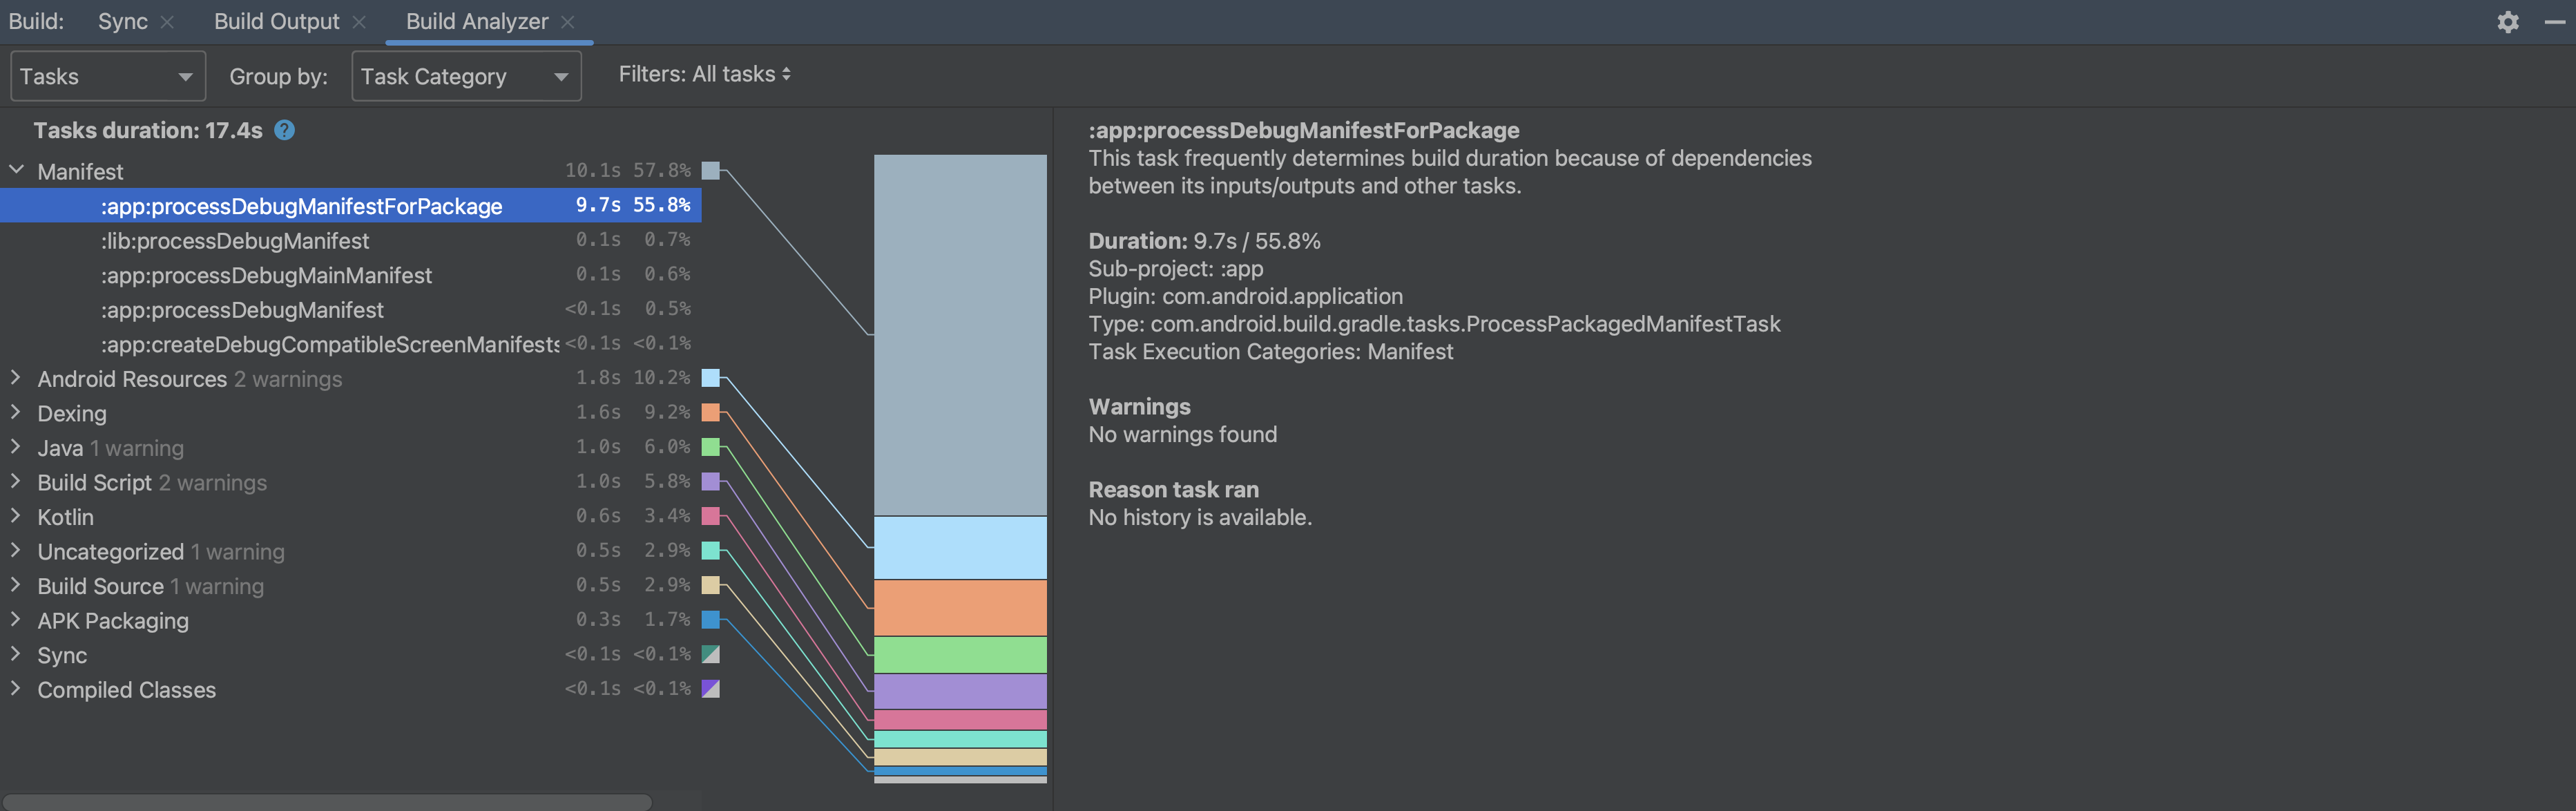
To view a breakdown of the tasks that contribute to your build's duration, click Tasks impacting build duration on the overview page or select Tasks from the dropdown. If your project uses AGP 8.0 or higher the tasks are grouped by category by default, so it's easier to identify areas that impact build duration. Click on each child task to learn more about its execution.
Inspect warnings
If the Build Analyzer detects that some tasks could be configured to run more efficiently, it provides a warning. To see all the warnings the Build Analyzer has identified for your build, click on All warnings on the overview page or select Warnings from the dropdown.
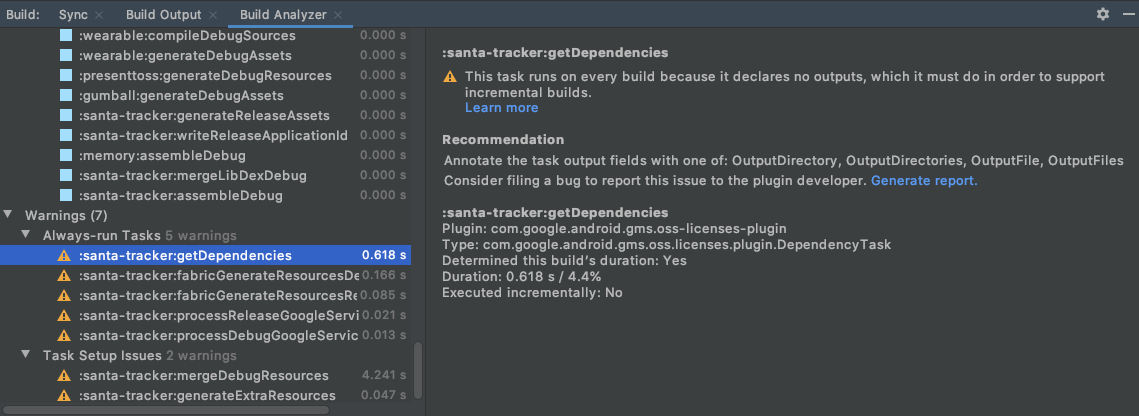
Some warnings have a Generate report link, as shown in figure 4. When you click the Generate report link, a dialog appears with additional information that might help the plugin developer resolve the issue in a new version of the plugin. Click Copy to save the text to your clipboard to more easily paste the information into a bug report to the plugin developer.
Warning types
The Build Analyzer reports the following warning types:
Always run tasks: An always running task makes other tasks run on every build, which is unnecessary. There are two main reasons why you might see this warning:
(More common) You did not declare task inputs and outputs correctly. If this is the case, you should properly declare the inputs and outputs for your tasks. This means declaring inputs and outputs yourself where you can or changing plugin versions if the tasks triggering the warning are from third-party plugins.
(Less common) A task has
upToDateWhenset to false, which should be avoided. It could be that there is some logic that evaluates to false or thatupToDateWhenis hardcoded to be false. If there is logic that evaluates to false, this outcome might be intentional, and you might choose to ignore the warning. IfupToDateWhenis hardcoded to be false, you should remove the hardcoding from your code.
Task setup issues: This warning is generated for tasks that declare the same directory as outputs. This means that those tasks outputs are most likely not being preserved between builds and those tasks always run, even when there are no changes. To address this warning you should declare different output directories for your tasks. This means declaring different output directories yourself where you can or changing plugin versions if the tasks triggering the warning are from third-party plugins.
Non-incremental annotation processor: This warning is generated in situations where an annotation processor is non-incremental and causes the
JavaCompiletask to always run non-incrementally. To address this warning, switch to an incremental annotation processor.Configuration cache: This warning is presented if configuration caching is not enabled for your project. The Build Analyzer walks through a sequence of builds to check whether your project is compatible with configuration caching. If the compatibility checks are successful, you can turn configuration caching on from the Build Analyzer.
Check Jetifier: This warning is presented if the
enableJetifierflag is present and enabled in your project; that is, if you haveandroid.enableJetifier=truein yourgradle.propertiesfile. The Build Analyzer can perform a check to see whether the flag can be safely removed to enable your project to have better build performance and migrate away from the unmaintained Android Support libraries.
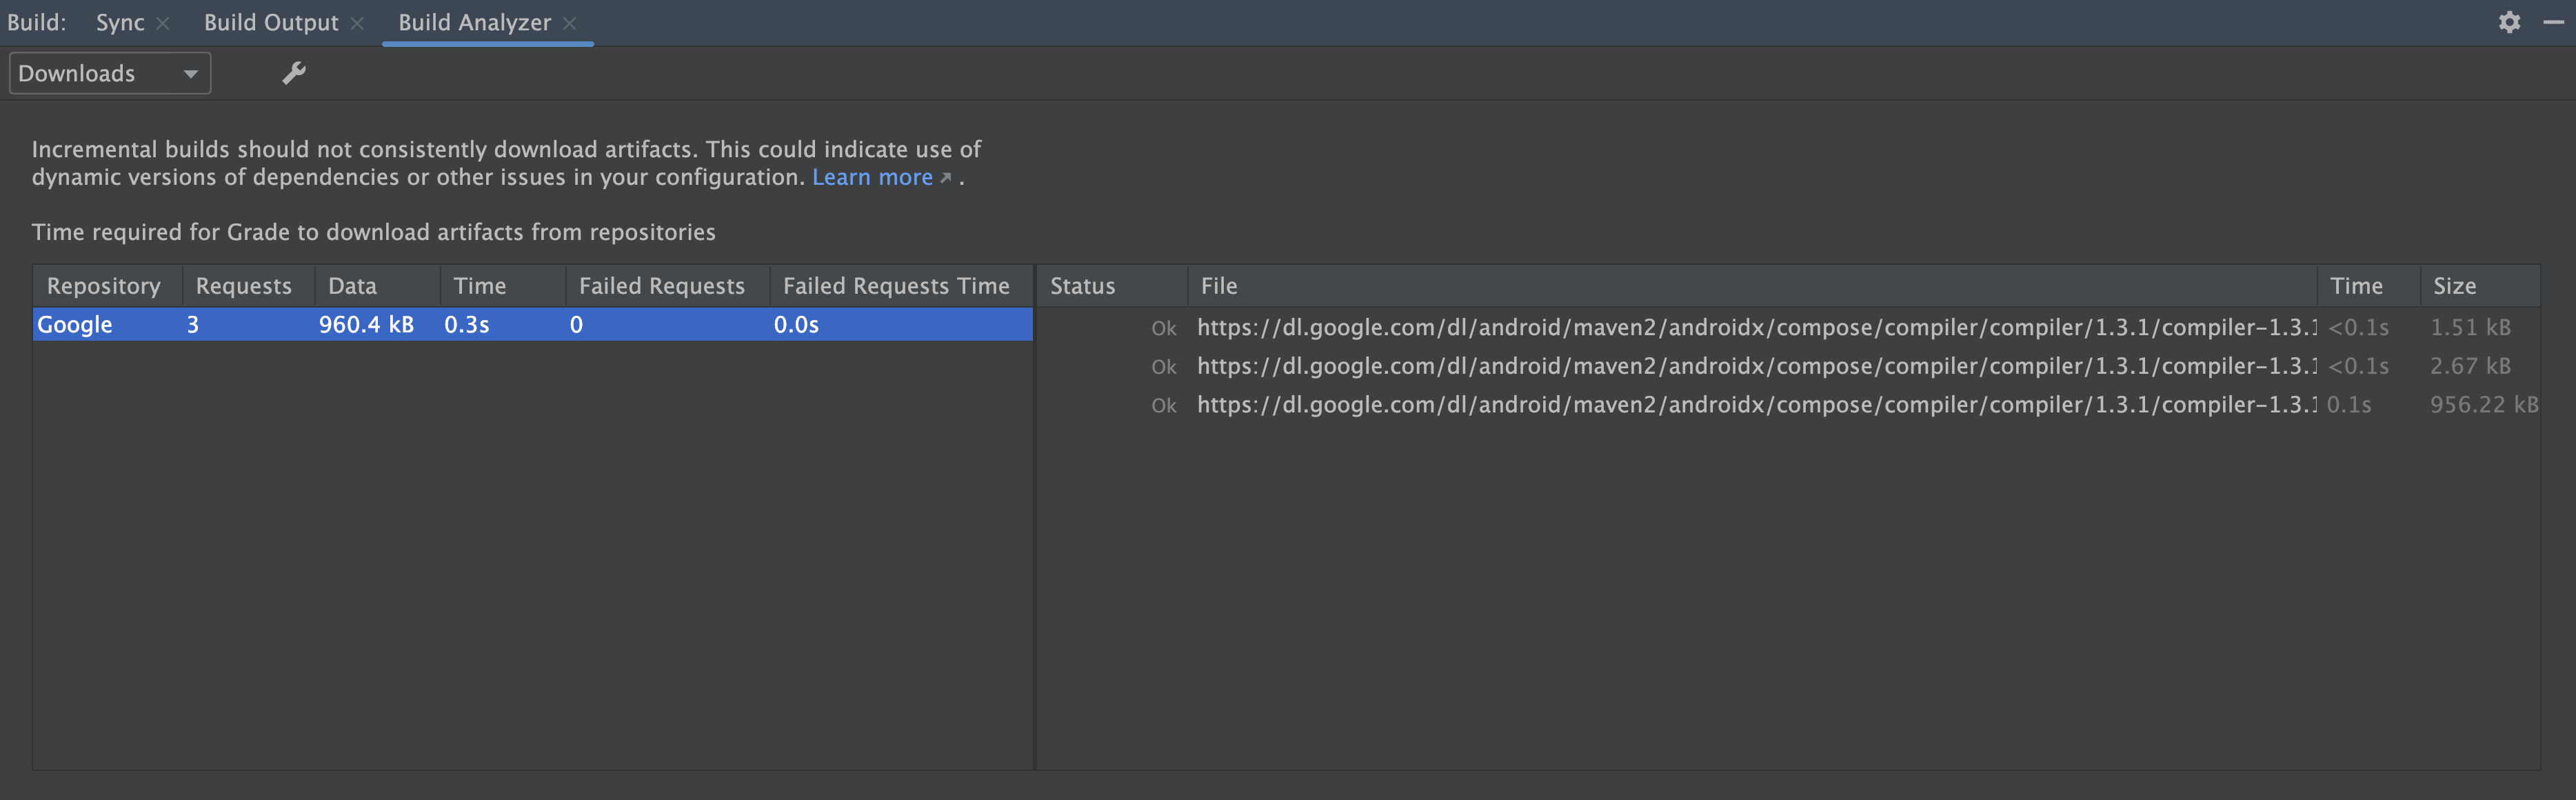
Check download impact
Build Analyzer provides a summary of time spent downloading dependencies and a detailed view of downloads per repository. To check the impact of downloads, select Downloads from the dropdown. This info is also available in the Sync window.
You can use this information to determine whether unexpected dependency downloads are negatively impacting your build performance. This is especially important during incremental builds, which shouldn't consistently download artifacts.
Specifically, you can use this information to identify configuration issues, such as use of dynamic versions of dependencies that cause unexpected downloads. Also, if you see a high number of failed requests for a specific repository, it could indicate that the repository should be removed or moved lower in your repository configuration.
[Windows-only] Check antivirus software impact
Build Analyzer informs you if antivirus software might be impacting your build performance. This can happen if antivirus software, such as Windows Defender, is doing real-time scanning of directories used by Gradle. Build Analyzer recommends a list of directories to exclude from active scanning and, if possible, it offers a link to add them to the Windows Defender folder exclusion list.