
1. Before you begin
In this codelab you'll learn to use the macrobenchmark library. You will measure app startup timing, which is a key metric for user engagement, and frame timing, which hints at where jank may occur in your app.
What you'll need
- Android Studio
- Knowledge of Kotlin
- Basic understanding of testing on Android
- A physical Android device with Android 6 (API level 23) or higher
What you'll do
- Add a benchmarking module to an existing application
- Measure app startup and frame timing
What you'll learn
- Reliably measure application performance
2. Getting set up
To get started, clone the Github repository from the command line by using the following command:
$ git clone https://github.com/android/codelab-android-performance.git
Alternatively, you can download two zip files:
Open Project into Android Studio
- On the Welcome to Android Studio window select
 Open an Existing Project
 - Select the folder
[Download Location]/android-performance/benchmarking(tip: make sure you select thebenchmarkingdirectory containingbuild.gradle) - When Android Studio has imported the project, ensure that you can run the
appmodule to build the sample application we'll benchmark.
3. Introduction to Jetpack Macrobenchmark
Jetpack Macrobenchmark library measures performance of larger end-user interactions, such as startup, interacting with the UI, and animations. The library provides direct control over the performance environment you're testing. It allows you to control compiling, starting and stopping your application to directly measure app startup, frame timings and traced code sections.
With Jetpack Macrobenchmark you can:
- measure the app multiple times with deterministic launch patterns and scroll speeds
- smooth out performance variance by averaging results over multiple test runs
- control the compilation state of your app – a major factor in performance stability
- check real world performance with local reproduction of install-time optimizations performed by Google Play Store
Instrumentations using this library don't call your application code directly, but instead navigate your application as a user would – touching, clicking, swiping, etc. The measurement happens on a device during these interactions. If you want to measure parts of your application code directly, see Jetpack Microbenchmark instead.
Writing a benchmark is like writing an instrumented test, except you don't need to verify the state your app is in. The benchmarks use the JUnit syntax (@RunWith, @Rule, @Test, etc.), but the tests run in a separate process to allow restarting or pre-compiling of your app. This allows us to run your app without interfering with its internal states, just as a user would. We do this by using UiAutomator to interact with the target application.
The sample app
In this codelab, you'll work with the JetSnack sample application. It's a virtual snack ordering app, using Jetpack Compose. To measure the performance of the application, you don't need to know the details of how the app is architected. What you'll need to understand is how the app behaves and the structure of the UI so you can access the UI elements from the benchmarks. Run the app and get familiar with the basic screens by ordering snacks of your choice.

4. Add the Macrobenchmark library
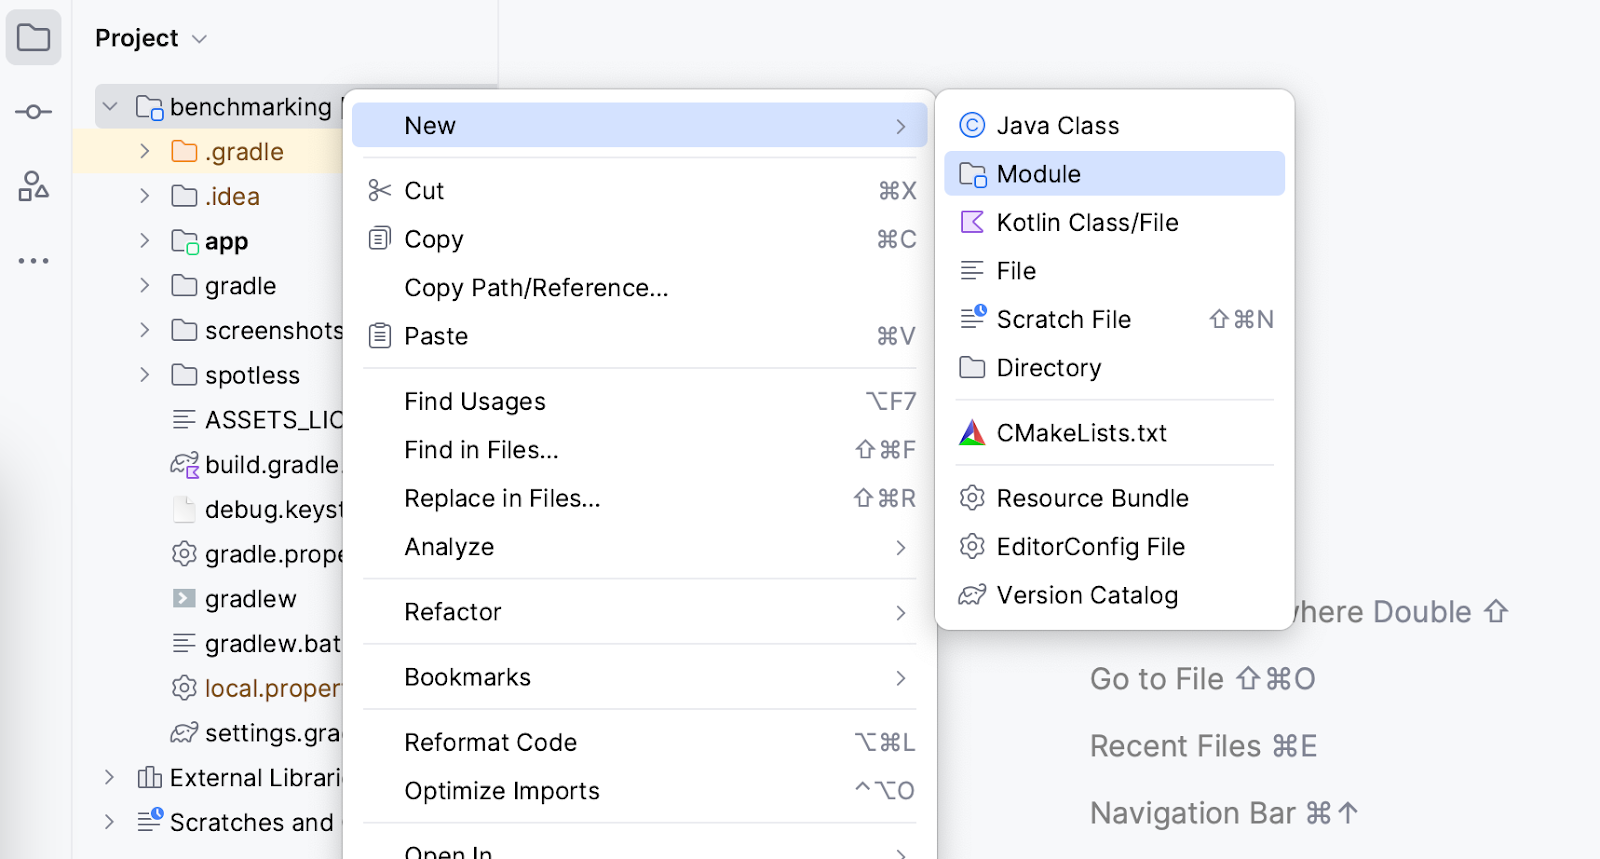
Macrobenchmark requires adding a new Gradle module to your project. The easiest way to add it to the project is with the Android Studio module wizard.
Open the new module dialog (for example, right-click your project or module in the Project panel and select New > Module).
Select Benchmark from the Templates pane, make sure Macrobenchmark is selected as the Benchmark module type and check the details are what you would expect:
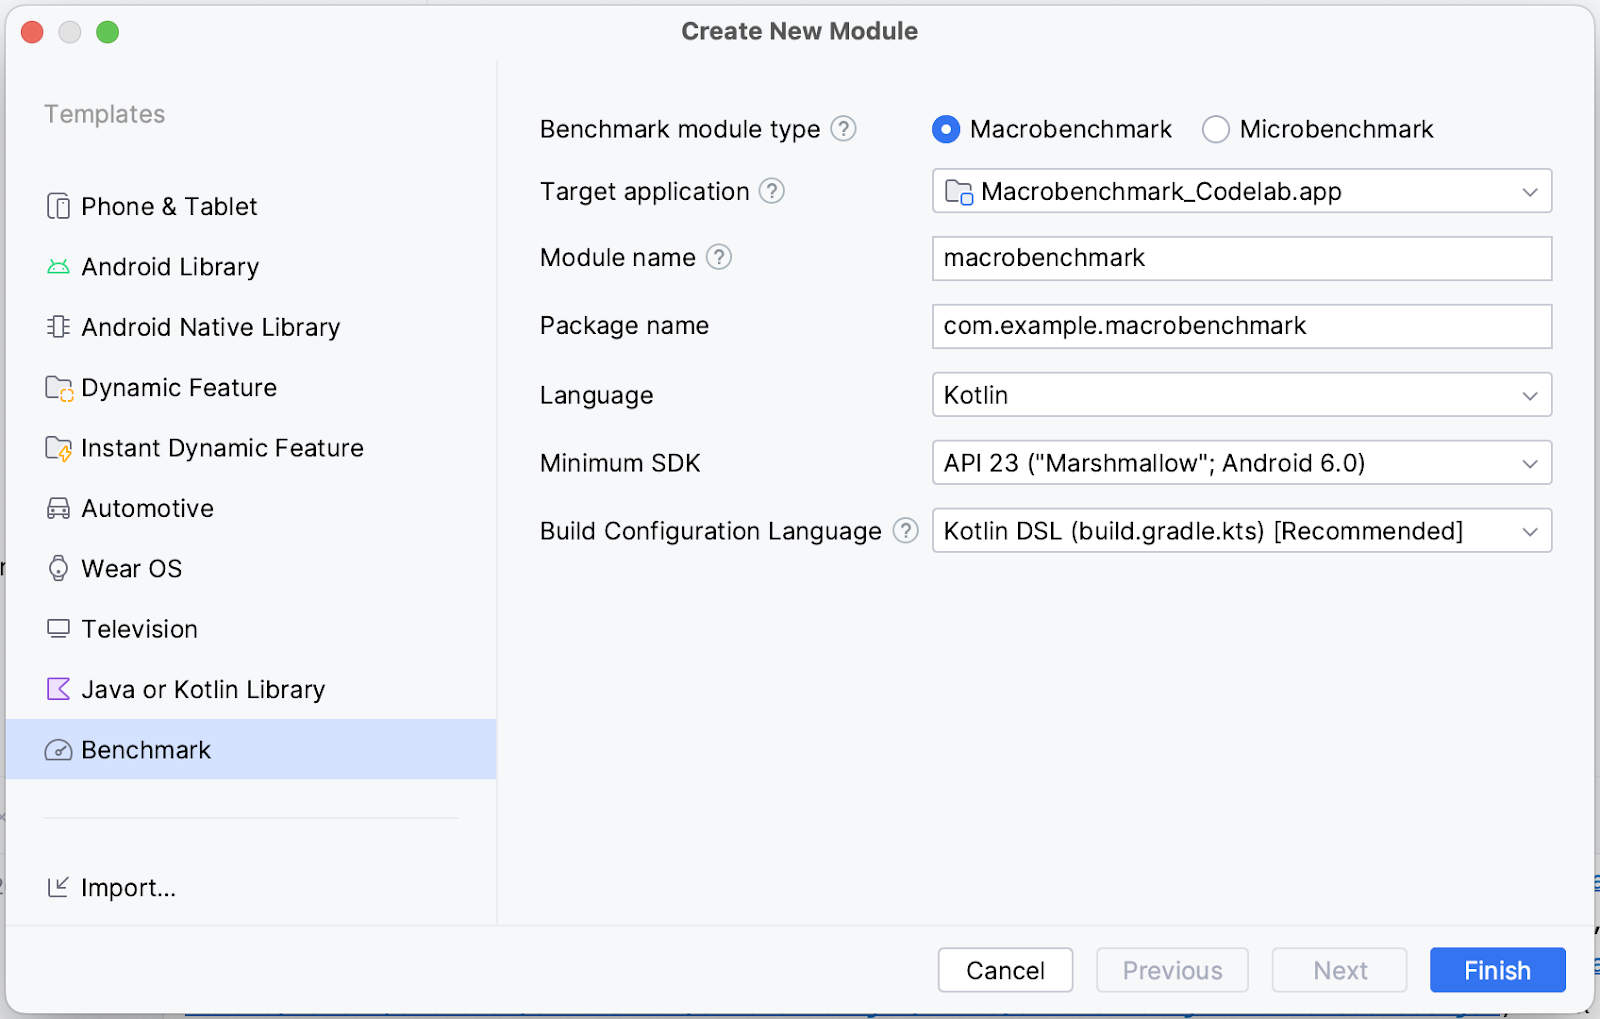
- Target application – the app that will be benchmarked
- Module name – name of the benchmarking Gradle module
- Package name – package name for benchmarks
- Minimum SDK – at least Android 6 (API level 23) or newer is required
Click Finish.
Changes made by the module wizard
The module wizard makes several changes to your project.
It adds a Gradle module named macrobenchmark (or the name you selected in the wizard). This module uses the com.android.test plugin, which tells Gradle not to include it in your application, so it can only contain testing code (or benchmarks).
The wizard also makes changes to the target application module you selected. Specifically, it adds new benchmark build type to the :app module build.gradle.kts as in the following snippet:
create("benchmark") {
   initWith(buildTypes.getByName("release"))
   matchingFallbacks += listOf("release")
   isDebuggable = false
}
This buildType should emulate your release buildType as closely as possible. The difference from release buildType is signingConfig set to debug that is needed just so you can build the app locally without requiring a production keystore.
However, because the debuggable flag is disabled, the wizard adds the <profileable> tag to your AndroidManifest.xml to allow benchmarks to profile your app with release performance.
<application>

  <profileable
     android:shell="true"
     tools:targetApi="29" />

</application>
To get more information about what <profileable> does, check our documentation.
The last thing the wizard does is it creates a scaffold to benchmark startup times (which we'll work with in the next step).
Now you're ready to start writing the benchmarks.
5. Measure app startup
App startup time, or the time it takes for users to begin using your app, is a key metric impacting user engagement. The module wizard creates an ExampleStartupBenchmark test class that is capable of measuring your app startup time and looks as follows:
@RunWith(AndroidJUnit4::class)
class ExampleStartupBenchmark {
   @get:Rule
   val benchmarkRule = MacrobenchmarkRule()

   @Test
   fun startup() = benchmarkRule.measureRepeated(
       packageName = "com.example.macrobenchmark_codelab",
       metrics = listOf(StartupTimingMetric()),
       iterations = 5,
       startupMode = StartupMode.COLD,
   ){
        pressHome()
        startActivityAndWait()
   }
}
What do all the parameters mean?
When writing a benchmark, your entrypoint is the measureRepeated function of the MacrobenchmarkRule. This function takes care of everything for your benchmarks, but you need to specify these parameters:
packageName– Benchmarks run in a separate process from the app under test, so you need to specify which application to measure.metrics– What type of information you want to measure during the benchmark. In our case, we're interested in app startup timing. Check documentation for other types of metrics.iterations– How many times the benchmark will repeat. More iterations mean more stable results, but at the cost of longer execution time. The ideal number will depend on how noisy this particular metric is for your app.startupMode– Allows you to define how your application should be started upon the start of your benchmark. Available isCOLD,WARMandHOT. We useCOLD, as that represents the biggest amount of work the app has to do.measureBlock(the last lambda parameter) – In this function you define the actions you want to measure during the benchmark (starting an Activity, clicking on UI elements, scrolling, swiping, etc.) and macrobenchmark will collect the definedmetricsduring this block.
How to write the benchmark actions
Macrobenchmark will reinstall and restart your app. Make sure you write interactions as being independent of the state of your app. Macrobenchmark provides several useful functions and parameters to interact with your app.
The most important one is startActivityAndWait(). This function will start your default Activity and wait until it renders the first frame before continuing with the instructions in your benchmark. If you want to start a different Activity, or tweak the starting Intent, you can use the optional intent or block parameter to do so.
Another useful function is pressHome(). This allows you to reset the benchmark to a base condition in cases where you don't kill your app in each iteration (for example. when you use StartupMode.HOT).
For any other interactions you can use the device parameter, which allows you to find UI elements, scroll, wait for some content, etc.
Okay, now we have defined a startup benchmark, you'll get to run it in the next step.
6. Run the benchmark
Before running the benchmark test, make sure you have the right build variant selected in Android Studio:
- Select Build Variants panel
- Change Active Build Variant to benchmark
- Wait for the Android Studio to synchronize
If you hadn't done that, the benchmark would fail at runtime with an error saying you shouldn't benchmark a debuggable application:
java.lang.AssertionError: ERRORS (not suppressed): DEBUGGABLE
WARNINGS (suppressed):

ERROR: Debuggable Benchmark
Benchmark is running with debuggable=true, which drastically reduces
runtime performance in order to support debugging features. Run
benchmarks with debuggable=false. Debuggable affects execution speed
in ways that mean benchmark improvements might not carry over to a
real user's experience (or even regress release performance).
You can temporarily suppress this error with the instrumentation argument androidx.benchmark.suppressErrors = "DEBUGGABLE". You can follow the same steps as in the Running benchmarks on Android Emulator step.
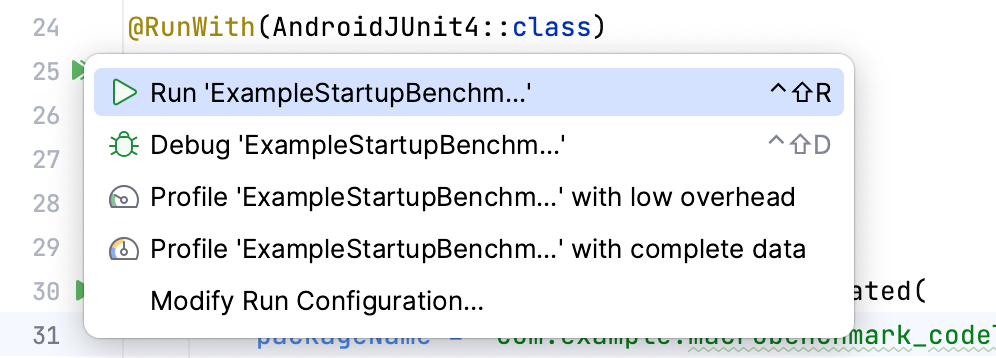
Now, you can run the benchmarks – the same way you would run instrumented tests. You can run the test function or the whole class with the gutter icon next to it.
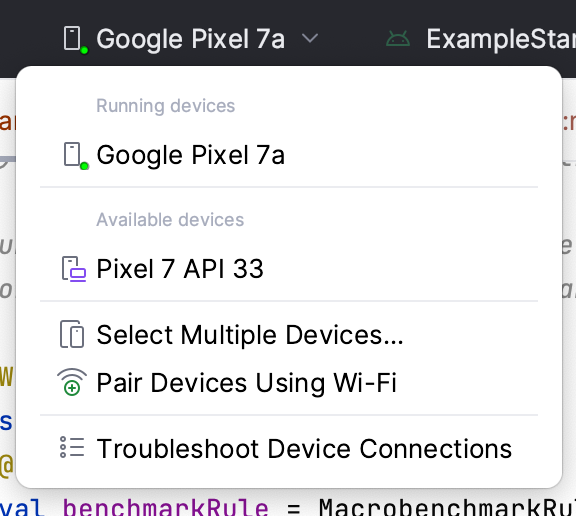
Make sure you have a physical device selected, because running benchmarks on Android emulator will fail at runtime with a warning that it would give incorrect results. While technically you can run it on an emulator, you're basically measuring your host machine performance – if that is under heavy load, your benchmarks will perform slower and vice versa.
Once you run the benchmark, your app will be rebuilt and then it will run your benchmarks. The benchmarks will start, stop and even reinstall your app several times based on the iterations you defined.
7. (Optional) Running benchmarks on Android Emulator
If you don't have a physical device and still want to run the benchmarks, you can suppress the runtime error with instrumentation argument androidx.benchmark.suppressErrors = "EMULATOR"
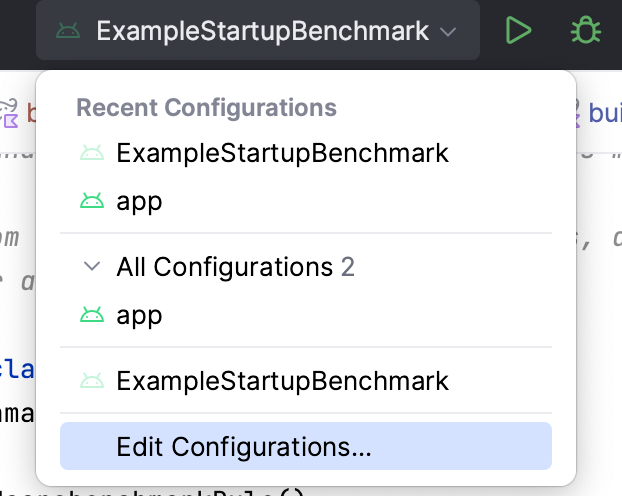
To suppress the error, edit your run configuration:
- Select "Edit Configurations..." from the run menu:
- From the opened window, select the "options" icon
 next to "Instrumentation arguments"
- Add the Instrumentation extra param by clicking ➕ and typing the details

- Confirm the choice by clicking OK. You should see the argument in the "Instrumentation arguments" row

- Confirm the Run configuration by clicking Ok.
Alternatively, if you need to have it permanently in your codebase, you can do that from your build.gradle in the :macrobenchmark module:
defaultConfig {
    // ...
    testInstrumentationRunnerArguments["androidx.benchmark.suppressErrors"] = 'EMULATOR'
}
8. Understand the startup results
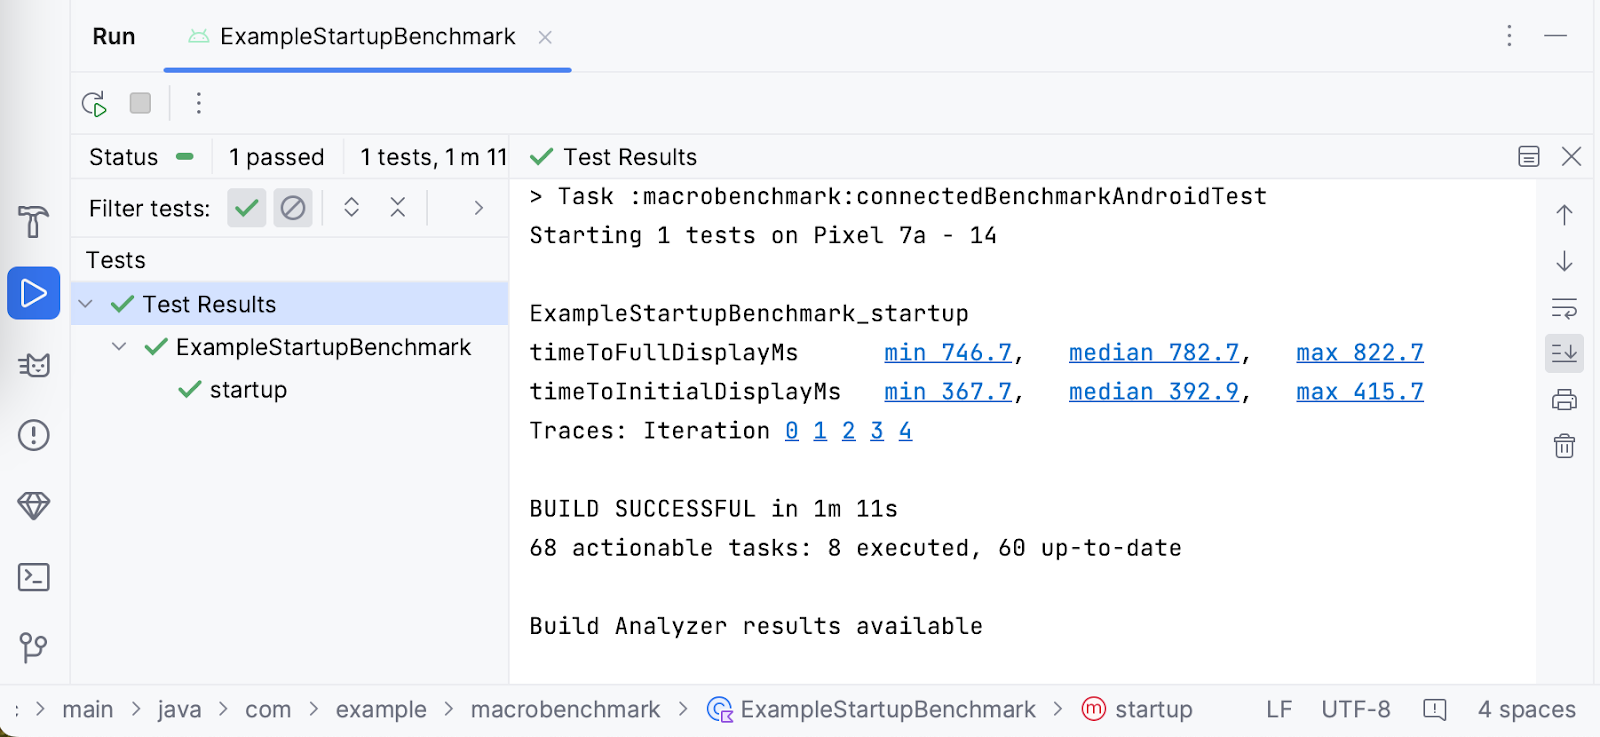
After the benchmark finishes running, it will give you results directly in Android Studio as in the following screenshot:
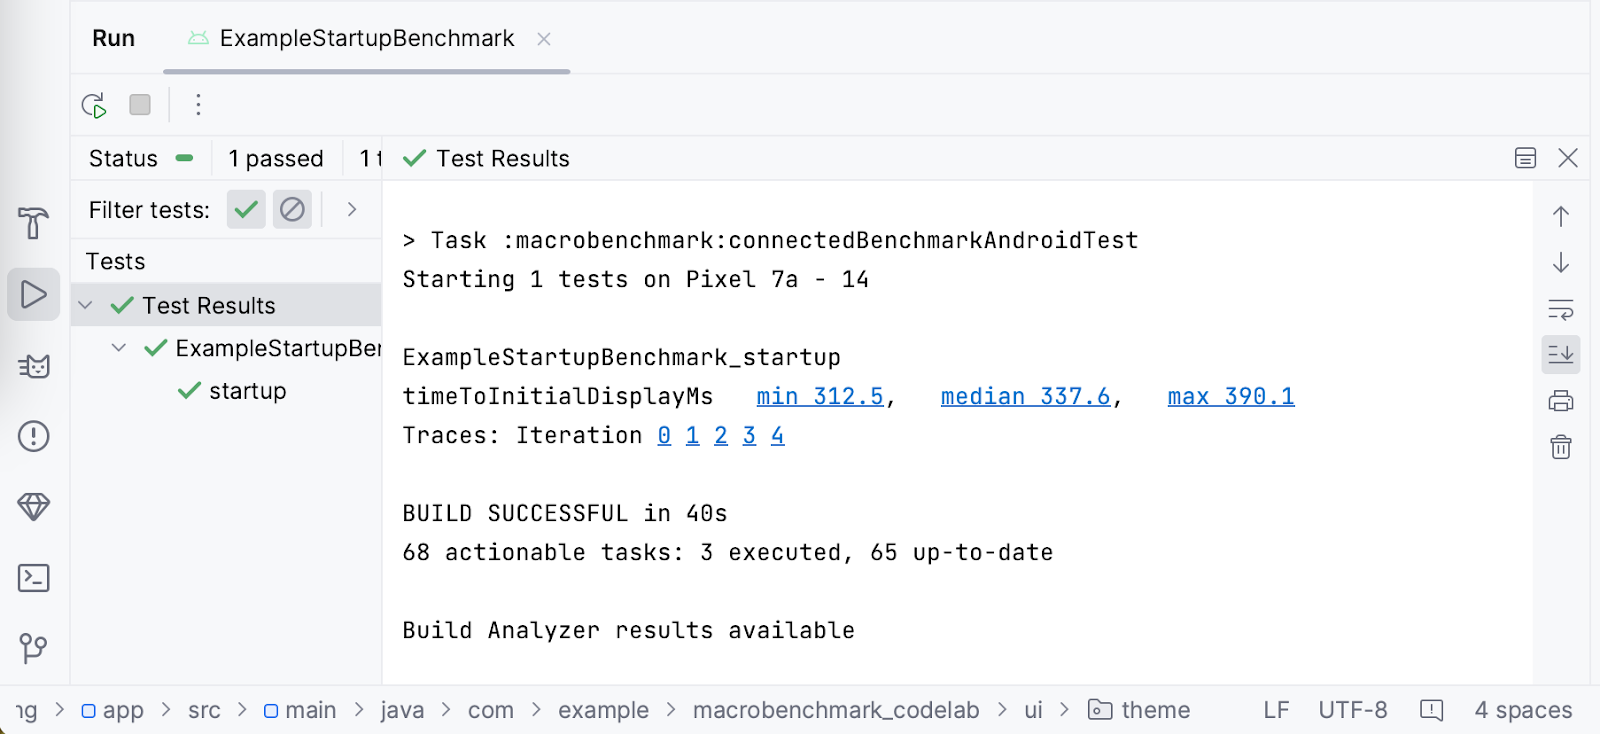
You can see that in our case, the startup time on Google Pixel 7a, the minimum value was 312.5ms, median was 337.6ms and maximum 390.1ms. Note that on your device, you may have different results when running the same benchmarks. The results can be affected by many factors, like:
- how powerful the device is
- what system version it uses
- what apps are running in the background
Because of that, it's important to compare results on the same device, ideally being in the same state, otherwise you can see great differences. If you can't guarantee the same state, you may want to increase the number of iterations to properly deal with the result outliers.
To allow investigation, Macrobenchmark library records system traces during the execution of the benchmarks. For convenience, Android Studio marks each iteration and the measured timings as links to the system trace, so you can easily open it to investigate.
9. (Optional exercise) Declare when your app is ready to use
Macrobenchmark can automatically measure time to the first frame rendered by your app (timeToInitialDisplay). However, it's common for the content of your app to not finish loading until after the first frame is rendered, and you may want to know how long the user has to wait until the app is usable. This is called time to full display – the app has fully loaded the content and the user can interact with it. Macrobenchmark library can automatically detect this timing, but you need to tweak your app to tell when it happened with Activity.reportFullyDrawn() function.
The sample shows a simple progress bar until data is loaded, so you want to wait until the data is ready and the list of snacks is laid out and drawn. Let's tweak the sample application and add the reportFullyDrawn() call.
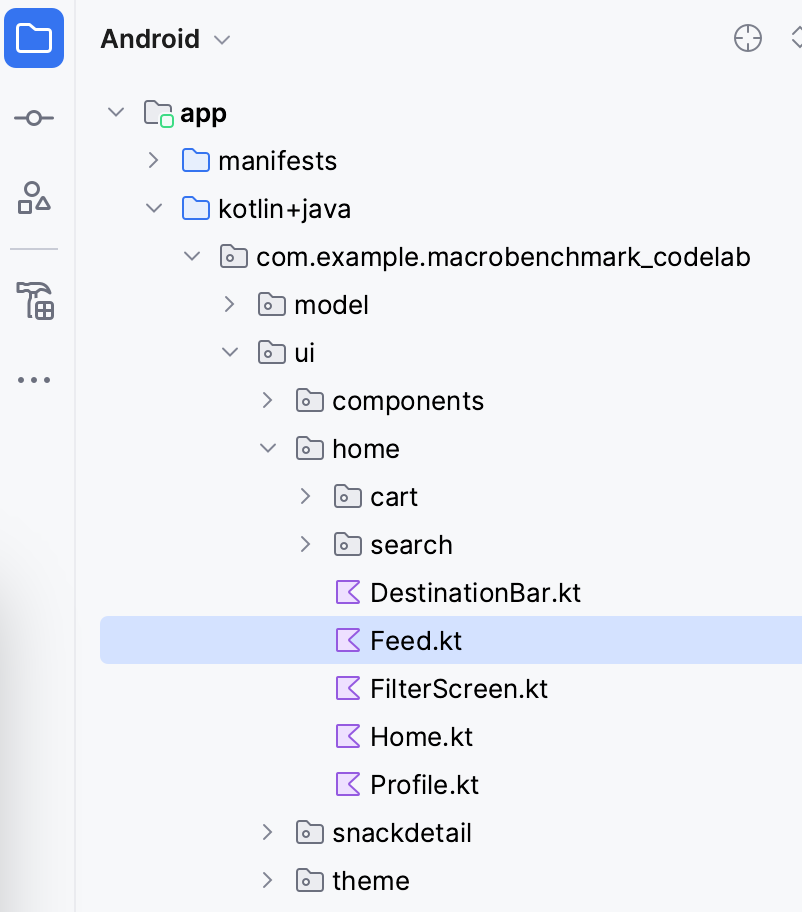
Open the Feed.kt file in the package .ui.home from the Project pane.
In that file, find the SnackCollectionList composable that is responsible for composing our list of snacks.
You need to check for the data to be ready. You know that until the content is ready, you get an empty list from the snackCollections parameter, so you can use ReportDrawnWhen composable that will take care of reporting once the predicate is true.
ReportDrawnWhen { snackCollections.isNotEmpty() }

Box(modifier) {
   LazyColumn {
   // ...
}
Alternatively, you can also use ReportDrawnAfter{} composable that accepts suspend function and waits until this function completes. This way you can wait for some data to be asynchronously loaded, or some animation finished.
Once you have this, you need to tweak the ExampleStartupBenchmark to wait for the content, otherwise the benchmark would finish with the first rendered frame and it could skip the metric.
The current startup benchmark waits only for the first rendered frame. The waiting itself is included in the startActivityAndWait() function.
@Test
fun startup() = benchmarkRule.measureRepeated(
   packageName = "com.example.macrobenchmark_codelab",
   metrics = listOf(StartupTimingMetric()),
   iterations = 5,
   startupMode = StartupMode.COLD,
) {
   pressHome()
   startActivityAndWait()

   // TODO wait until content is ready
}
In our case, you can wait until the content list has some children, so add wait() as in the following snippet:
@Test
fun startup() = benchmarkRule.measureRepeated(
   //...
) {
   pressHome()
   startActivityAndWait()

   val contentList = device.findObject(By.res("snack_list"))
   val searchCondition = Until.hasObject(By.res("snack_collection"))
   // Wait until a snack collection item within the list is rendered
   contentList.wait(searchCondition, 5_000)
}
To explain what happens in the snippet:
- We find the snack list thanks to the
Modifier.testTag("snack_list") - We define the search condition that uses
snack_collectionas an element to wait for - We use
UiObject2.waitfunction to wait for the condition within the UI object with 5 seconds timeout
Now, you can run the benchmark again and the library will automatically measure timeToInitialDisplay and timeToFullDisplay as in the following screenshot:
You can see that the difference between TTID and TTFD in our case is 389.8ms. This means that even though your users see a first frame rendered in 392.9ms, they won't be able to scroll the list for an additional 389.8ms.
10. Benchmark frame timing
After your users land in your app, the second metric they encounter is how smooth the app is. Or in our terms, whether the app drops any frames. To measure it, we'll use FrameTimingMetric.
Let's say you want to measure the scrolling behavior of the list of items and don't want to measure anything before that scenario. You need to split the benchmark into measured and not measured interactions. To do that, we'll use the setupBlock lambda parameter.
In the not measured interactions (defined in the setupBlock) we'll start the default Activity and in the measured interactions (defined in the measureBlock) we'll find the UI list element, scroll the list and wait until the screen renders the content. If you hadn't split the interactions into the two parts, you wouldn't be able to differentiate between the frames produced during app startup and the frames produced during the list scrolling.
Create frame timing benchmark
To achieve the mentioned flow, let's create a new ScrollBenchmarks class with a scroll() test that will contain the scrolling frame timing benchmark. First, you create the test class with the benchmark rule and empty test method:
@RunWith(AndroidJUnit4::class)
class ScrollBenchmarks {
   @get:Rule
   val benchmarkRule = MacrobenchmarkRule()

   @Test
   fun scroll() {
       // TODO implement scrolling benchmark
   }
}
Then, add the benchmark skeleton with required parameters.
@Test
fun scroll() {
   benchmarkRule.measureRepeated(
       packageName = "com.example.macrobenchmark_codelab",
       iterations = 5,
       metrics = listOf(FrameTimingMetric()),

       setupBlock = {
           // TODO Add not measured interactions.
       }
   ) {
       // TODO Add interactions to measure list scrolling.
   }
}
The benchmark uses the same parameters as for the startup benchmark, except the metrics parameter and the setupBlock. The FrameTimingMetric collects the timing of the frames produced by the application.
Now, let's fill in the setupBlock. As mentioned previously, in this lambda, the interactions are not measured by the benchmark. You can use this block to just open the app and wait for the first frame to be rendered.
@Test
fun scroll() {
   benchmarkRule.measureRepeated(
       packageName = "com.example.macrobenchmark_codelab",
       iterations = 5,
       metrics = listOf(FrameTimingMetric()),
       startupMode = StartupMode.COLD,
       setupBlock = {
           // Start the default activity, but don't measure the frames yet
           pressHome()
           startActivityAndWait()
       }
   ) {
       // TODO Add interactions to measure list scrolling.
   }
}
And now, let's write the measureBlock (the last lambda parameter). First, since submitting items to the snack list is an asynchronous operation, you should wait until the content is ready.
benchmarkRule.measureRepeated(
   // ...
) {
    val contentList = device.findObject(By.res("snack_list"))

    val searchCondition = Until.hasObject(By.res("snack_collection"))
    // Wait until a snack collection item within the list is rendered
    contentList.wait(searchCondition, 5_000)

   // TODO Scroll the list
}
Optionally, if you're not interested in measuring the initial layout setup, you may wait for the content readiness in the setupBlock.
Next, set gesture margins to the snack list. You need to do this, because otherwise the app could trigger the system navigation and leave your app instead of scrolling the content.
benchmarkRule.measureRepeated(
   // ...
) {
   val contentList = device.findObject(By.res("snack_list"))

   val searchCondition = Until.hasObject(By.res("snack_collection"))
   // Wait until a snack collection item within the list is rendered
   contentList.wait(searchCondition, 5_000)

   // Set gesture margin to avoid triggering system gesture navigation
   contentList.setGestureMargin(device.displayWidth / 5)

   // TODO Scroll the list
}
In the end, you actually scroll the list with the fling() gesture (you can also use scroll() or swipe() depending how much and how fast you want to scroll) and wait for the UI to become idle.
benchmarkRule.measureRepeated(
   // ...
) {
   val contentList = device.findObject(By.res("snack_list"))

   val searchCondition = Until.hasObject(By.res("snack_collection"))
   // Wait until a snack collection item within the list is rendered
   contentList.wait(searchCondition, 5_000)

   // Set gesture margin to avoid triggering gesture navigation
   contentList.setGestureMargin(device.displayWidth / 5)

   // Scroll down the list
   contentList.fling(Direction.DOWN)

   // Wait for the scroll to finish
   device.waitForIdle()
}
The library will measure the timing of frames produced by our app when performing the defined actions.
Now you have the benchmark ready to run.
Run the benchmark
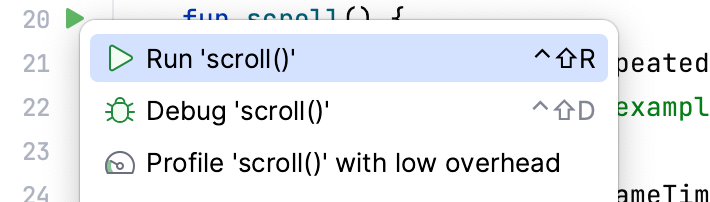
You can run the benchmark the same way as the startup benchmark. Click the gutter icon next to the test and select Run ‘scroll()'.
If you need more information about running the benchmark, check the Run the benchmark step.
Understand the results
The FrameTimingMetric outputs duration of frames in milliseconds (frameDurationCpuMs) in 50th, 90th, 95th and 99th percentile. On Android 12 (API level 31) and higher, it also returns how much time your frames were over the limit (frameOverrunMs). The value can be negative, which means there was extra time left to produce the frame.
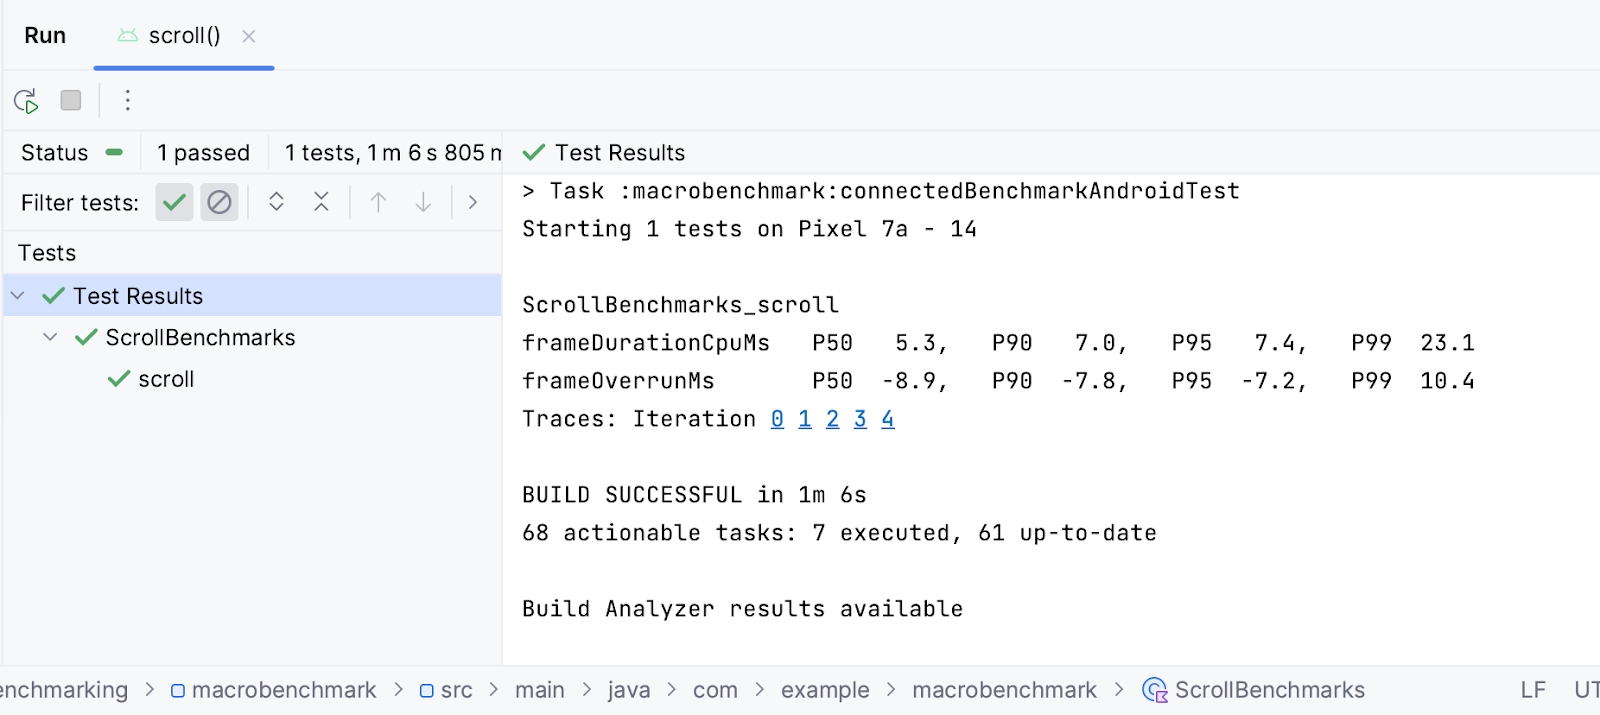
You can see from the results that the median value (P50) to create a frame on a Google Pixel 7 was 3.8ms, which is 6.4ms under the frame time limit. But also, there may have been some skipped frames in the percentile over 99 (P99), because the frames took 35.7ms to produce, which was 33.2ms over the limit.
Similarly to app startup results, you can click the iteration to open the system trace recorded during the benchmark and investigate what contributed to the resulting timings.
11. Congratulations
Congratulations, you've successfully completed this codelab on measuring performance with Jetpack Macrobenchmark!
What's next?
Check out Improve app performance with Baseline Profiles codelab. Also, check our performance samples Github repository containing Macrobenchmark and other performance samples.