
Battery Historian 工具可提供裝置在一段時間內的電池效能深入分析。在系統層級中,工具會以 HTML 表示法視覺化呈現系統記錄的電力相關事件。在特定應用程式層級,工具會提供多種不同的資料,協助您辨識比較耗電的應用程式行為。
本文說明幾種使用 Battery Historian 的方式,讓您可用以瞭解電池耗電的模式。一開始我們會先說明如何解讀 Battery Historian 報表中的系統通盤資料,然後會說明幾種使用 Battery Historian 的方式,協助您用以診斷及排解應用程式與電池耗電的相關行為問題。最後,文章中還會指出幾個特別適合使用 Battery Historian 的使用情境,並分享操作秘訣。
使用系統通盤檢視
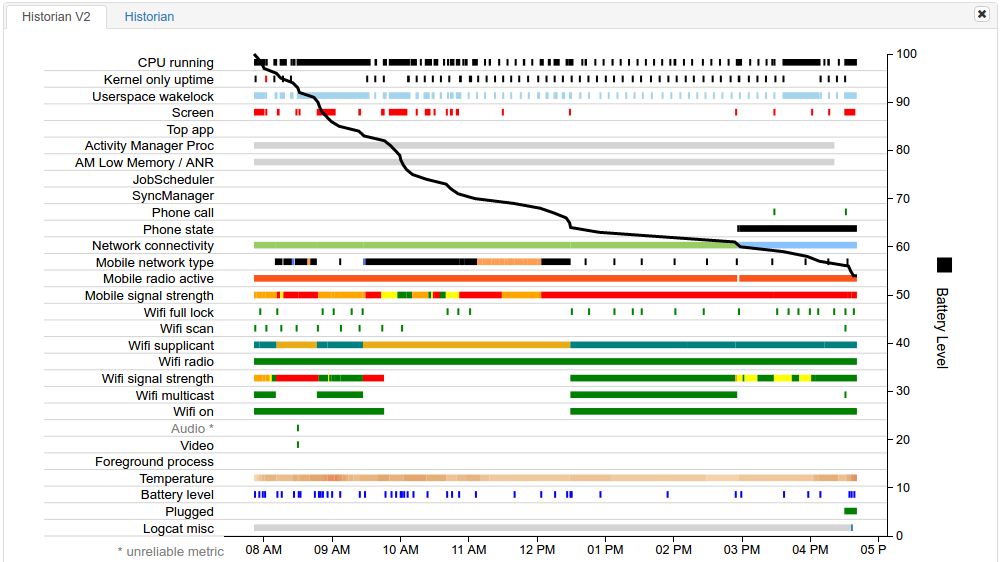
Battery Historian 工具可針對多種不同的應用程式和系統行為,提供系統通盤視覺化內容檢視,並且說明這些行為在一段時間內與電池耗電量之間的關係。如圖 1 所示,此檢視畫面可協助您診斷和辨識應用程式的電力使用相關問題。
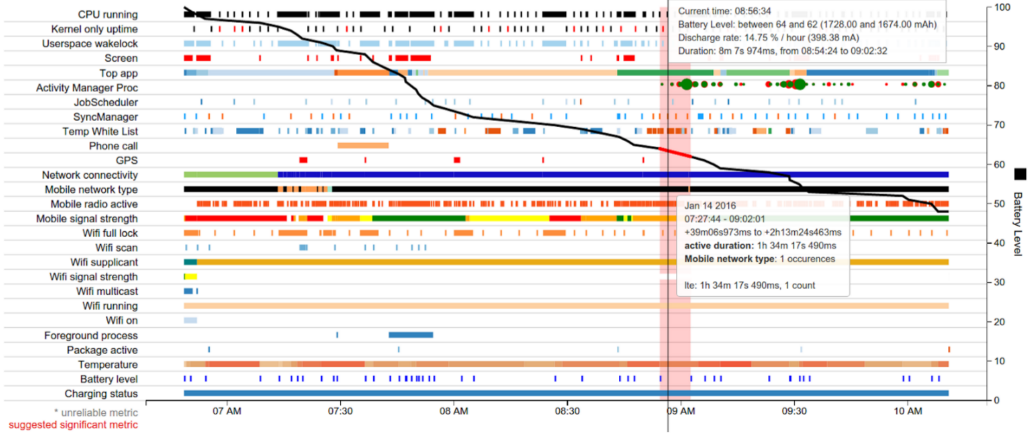
此圖焦點是水平向下的黑色趨勢線條,其代表電池電量,以 Y 軸表示。舉例來說,在電池電量線的起始處,時間約是早上 6:50 的地方,畫面顯示電池電量出現相對陡降的情況。
圖 2 為圖片中該部分的放大檢視。
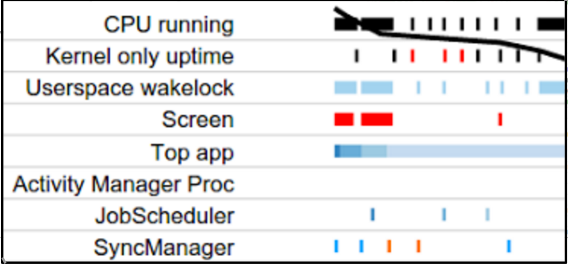
在電池電量線的起始處,電池電量開始急遽下降,畫面顯示當時發生了三件事:CPU 正在執行、應用程式取得了喚醒鎖定,而且螢幕也已經開啟。因此,您只要查看 Battery Historian 就可以瞭解電池耗電量很高的時候發生了哪些事件;並在應用程式中針對這些行為展開調查,瞭解是否能採行相關的最佳化作業。
系統通盤視覺化資料也可以提供其他線索。舉例來說,如果資料顯示行動無線電經常開關,也許您可以透過智慧型排程 API (例如:JobScheduler 或 Firebase Job Dispatcher),針對這種行為進行最佳化。
下一節我們將說明如何調查應用程式特定的行為和事件。
檢視應用程式特定資料
除了系統的通盤檢視畫面會提供宏觀資料,Battery Historian 還會另外針對在裝置中執行的各個應用程式,提供個別表格和某些視覺化資料。表格資料包括:
- 裝置上應用程式的預估耗電量。
- 網路資訊。
- 喚醒鎖定次數。
- 服務。
- 處理程序資訊。
表格會提供應用程式的兩種資料維度。首先,您可以查看您的應用程式與其他應用程式的電力使用比較。若要執行此操作,請按一下「Tables」下方的「Device Power Estimates」。此範例以虛構的應用程式「Pug Power」為例。
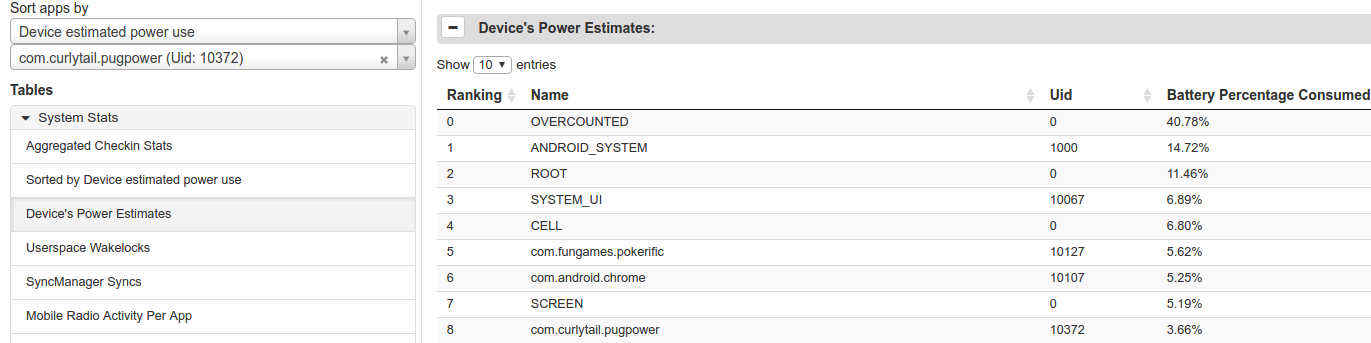
圖 3 中的表格顯示,Pug Power 是莊志忠耗電量排名第九的應用程式,也是非 OS 中排名第三的應用程式。根據此資料顯示,這個應用程式應進行更深入的調查。
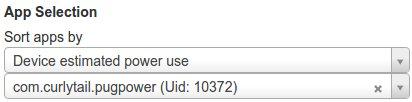
如要查詢特定應用程式的資料,請找出圖表左側「App Selection」底下的兩個下拉式選單,然後在第二個選單中輸入套件名稱。
選取特定應用程式時,下列資料顯示畫面類別會變更為顯示應用程式特定資料,而非系統通盤資料:
- SyncManager。
- 前景程序。
- 使用者空間喚醒鎖定。
- 頂端應用程式
- JobScheduler。
- Activity Manager Proc。
SyncManager 和 JobScheduler 顯示畫面會立即標明應用程式是否過度執行同步處理和執行工作。如此一來,您就可以快速查看應用程式行為是否需要最佳化,藉以改善電池效能。
您也可以再取得一個應用程式專屬的圖表資料,也就是「使用者空間喚醒鎖定」。如要在錯誤報告中納入此資訊,請在終端機視窗中輸入下列指令:
$ adb shell dumpsys batterystats --enable full-wake-history
圖 5 和圖 6 顯示 Pug Power 的資料:圖 5 顯示應用程式特定資料的顯示畫面,而圖 6 顯示對應的表格資料。
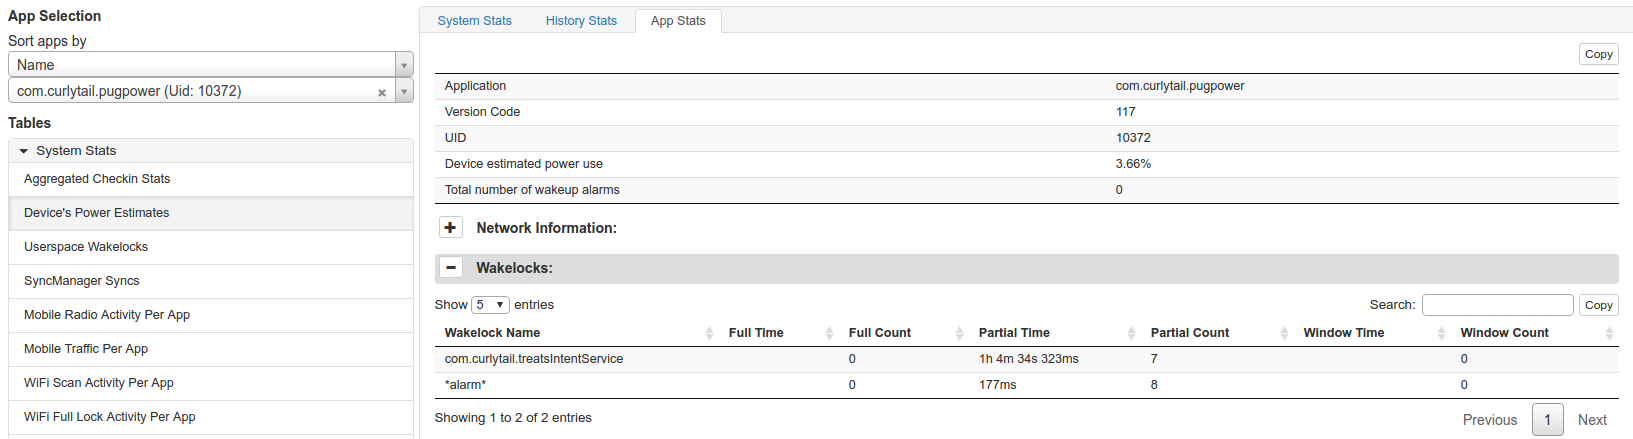
當然,顯示畫面不會立即顯示任何內容。JobScheduler 行顯示應用程式沒有已排程的工作。SyncManager 行顯示應用程式尚未執行任何同步處理。
但是檢查表格資料的「喚醒鎖定」區段我們卻發現,Pug Power 擷取喚醒鎖定的時間總共超過一個小時。這種不尋常又且成本高的行為,就是應用程式高耗電的原因。此資訊可以協助開發人員針對最需要改進的部分進行最佳化。在此範例中,應用程式為何會需要這麼多時間執行喚醒鎖定?開發人員該如何改善這個行為?
Battery Historian 可協助支援的其他情況
在許多情況下,Battery Historian 都能協助您診斷潛在問題,提升電池效能。舉例來說,如果應用程式發生以下情況,Battery Historian 就可以通知您:
- 觸發喚醒鬧鐘的頻率過高 (每 10 秒一次或更短)。
- 持續執行 GPS 鎖定。
- 已排定的工作為每 30 秒一次或更短。
- 排程的同步處理每 30 秒一次或更短。
- 使用手機無線電的頻率高於預期。