
The Battery Historian tool provides insight into a device’s battery consumption over time. At a system-wide level, the tool visualizes power-related events from the system logs in an HTML representation. At an app-specific level, the tool provides a variety of data that can help you identify battery-draining app behavior.
This document describes some of the ways you can use Battery Historian to learn about battery-consumption patterns. The document begins by explaining how to read the system-wide data that Battery Historian reports. Then, it presents ways in which you can use Battery Historian to diagnose and troubleshoot your own app's behavior related to battery consumption. Last, it offers several tips on scenarios in which Battery Historian may be particularly useful.
Use the system-wide view
The Battery Historian tool provides a system-wide visualization of various app and system behaviors, along with their correlation against battery consumption over time. This view, shown in Figure 1, can help you diagnose and identify power use issues with your app.
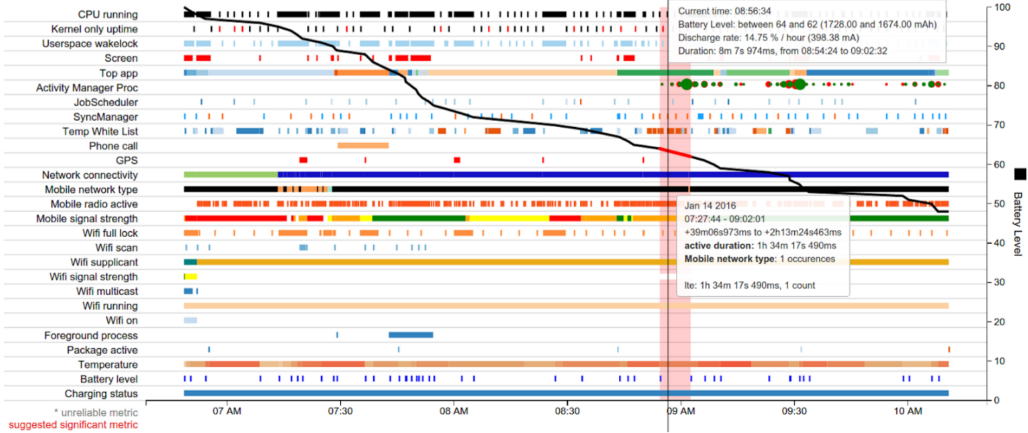
Of particular interest in this figure is the black, horizontal, downward trend line representing Battery Level, measured on the y-axis. For example, at the very beginning of the Battery Level line, at approximately 6:50 AM, the visualization shows a relatively steep drop in battery level.
Figure 2 provides a close-up of that part of the display.
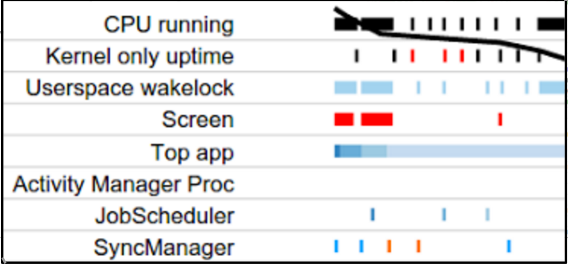
At the very beginning of the Battery Level line, as battery decline steeply, the display shows three things happening: The CPU is running, an app has acquired a wakelock, and the screen is on. In this way, Battery Historian helps you understand what events are happening when battery consumption is high. You can then target these behaviors in your app and investigate whether there are related optimizations you can make.
The system-wide visualization can provide other clues, as well. For instance, if it shows that the mobile radio is frequently being turned off and on, there may be an opportunity to optimize this behavior through intelligent scheduling APIs such as JobScheduler or Firebase Job Dispatcher.
The next section explains how to investigate behavior and events specific to your own app.
View app-specific data
In addition to the macro-level data provided by the system-wide view, Battery Historian also provides tables and some visualization of data specific to each app running on your device. The tabular data includes:
- The app’s estimated power use on the device.
- Network information.
- Wakelocks.
- Services.
- Process info.
The tables provide two dimensions of data about your app. First, you can look up where your app’s power usage ranks compared to other apps. To do so, click Device Power Estimates table under Tables. This example examines a fictional app called Pug Power.
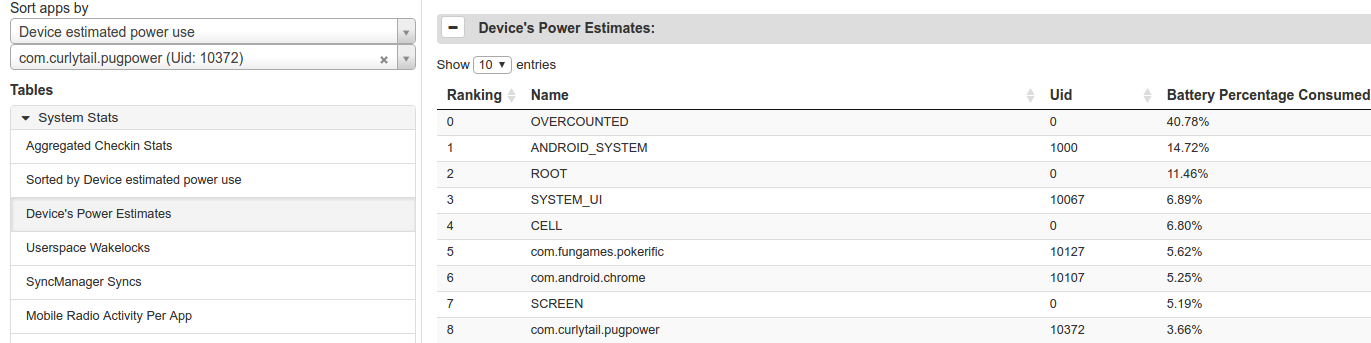
The table in Figure 3 reveals that Pug Power is the ninth biggest consumer of battery power on this device, and the third biggest app that is not part of the OS. This data suggests that this app bears deeper investigation.
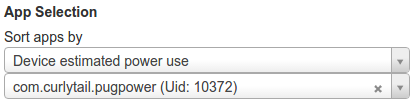
To look up the data for a specific app, enter its package name into the lower of the two dropdown menus under App Selection, located under the left side of the visualization.
When you select a specific app, the following data visualization categories change to display app-specific data instead of system-wide data:
- SyncManager.
- Foreground process.
- Userspace Wakelock.
- Top app.
- JobScheduler.
- Activity Manager Proc.
The SyncManager and JobScheduler visualizations immediately make it obvious if your app performs syncs and executes jobs more frequently than necessary. In doing so, they can quickly reveal an opportunity to optimize your app’s behavior for improved battery performance.
You can also obtain one more piece of app-specific visualization data, Userspace Wakelock. To include this information in the bug report, enter the following command in your terminal window:
$ adb shell dumpsys batterystats --enable full-wake-history
Figures 5 and 6 show data for Pug Power: Figure 5 shows the visualization of the app-specific data, and Figure 6 shows the corresponding tabular data.

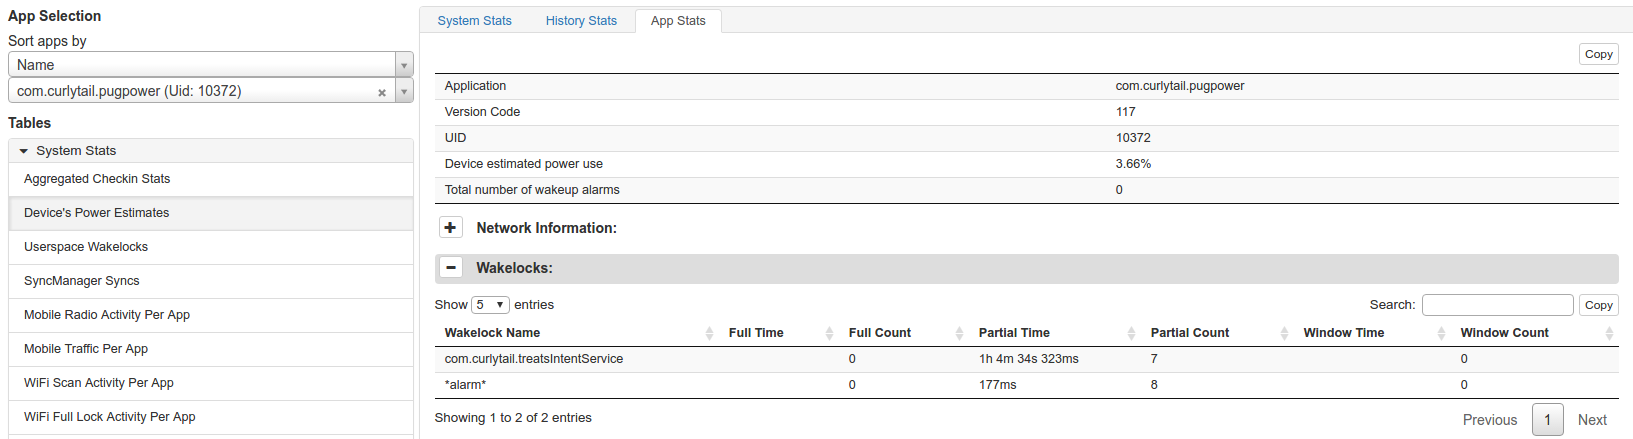
A look at the visualization does not show anything immediately obvious. The JobScheduler line shows that the app has no jobs scheduled. The SyncManager line shows that the app has not performed any syncs.
However, examination of the Wakelocks segment of the tabular data reveals that Pug Power acquires wakelocks totaling over an hour. This unusual and costly behavior can account for the app’s high level of power consumption. This piece of information helps the developer target an area where optimization is likely to greatly help. In this case, why does the app acquire so much wakelock time, and how can the developer ameliorate this behavior?
Other cases where Battery Historian can help
There are many other cases in which Battery Historian can help you diagnose opportunities for improving battery behavior. For example, Battery Historian can tell you if your app is:
- Firing wakeup alarms overly frequently (every 10 seconds or less).
- Continuously holding a GPS lock.
- Scheduling jobs every 30 seconds or less.
- Scheduling syncs every 30 seconds or less.
- Using the cellular radio more frequently than you expect.