
This page lists the new features introduced in Android Studio preview releases. The preview builds provide early access to the latest features and improvements in Android Studio. You can download these preview versions. If you encounter any problems using a preview version of Android Studio, let us know. Your bug reports help to make Android Studio better.
Canary releases contain leading edge features under active development, and are lightly tested. While you can use Canary builds for development, be aware that features might be added or changed. Release Candidates (RC) are the next version of Android Studio, and are almost ready for stable release. The feature set for the next version has been stabilized. See Android Studio release names to understand Android Studio version naming.
For the latest news on Android Studio preview releases, including a list of notable fixes in each preview release, see the Release Updates in the Android Studio blog.
Current versions of Android Studio
The following table lists the current versions of Android Studio and their respective channels.
| Version | Channel |
|---|---|
| Android Studio Quail 1 | Stable |
| Android Gradle plugin 9.2.0 | Stable |
| Android Studio Quail 2 | RC |
| Android Studio Quail 3 | Canary |
Compatibility with Android Gradle plugin previews
Each preview version of Android Studio is published alongside a corresponding version of the Android Gradle plugin (AGP). Preview versions of Studio should work with any compatible stable version of AGP. However, if you're using a preview version of AGP, you must use the corresponding preview version of Studio (for example, Android Studio Chipmunk Canary 7 with AGP 7.2.0-alpha07). Attempts to use divergent versions (for example, Android Studio Chipmunk Beta 1 with AGP 7.2.0-alpha07) will cause a Sync failure, which results in a prompt to update to the corresponding version of AGP.
For a detailed log of Android Gradle plugin API deprecations and removals, see the Android Gradle plugin API updates.
Studio Labs
Studio Labs lets you try out the latest AI experimental features in a stable version of Android Studio, so you can more quickly integrate our AI assistance offerings in your development workflow. For more information, see Studio Labs.
The following are features currently available in Studio Labs.
| Feature | Description | Docs |
|---|---|---|
| Journeys for Android Studio | Use natural language to describe steps and assertions for end-to-end tests. | Journeys for Android Studio |
Android Studio Quail 2
The following are new features in Android Studio Quail 3.
To see what's been fixed in this version of Android Studio, see the closed issues.
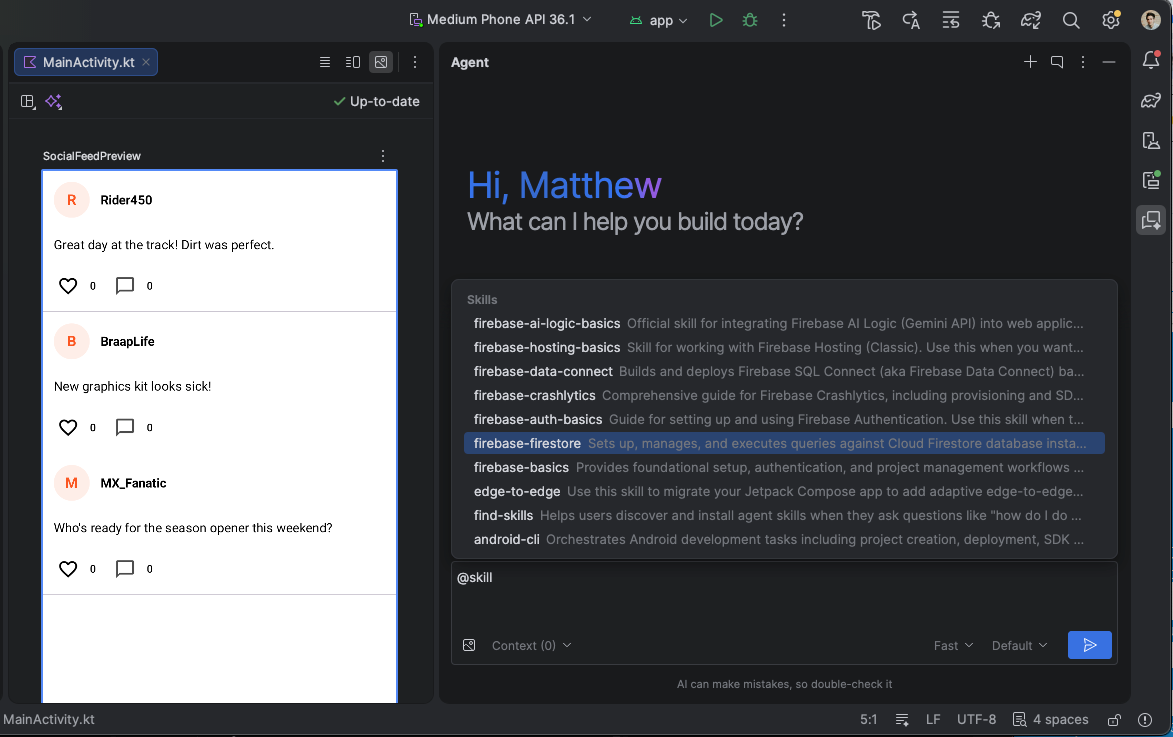
More agent skills
Android Studio supports agent skills, which are modular instruction sets that ground the agent in specialized workflows and domain-specific knowledge. By adding skills to your project, you can teach the agent to follow specific best practices, architecture patterns, and workflows. This enables more accurate, context-aware code generation and automated skill activation when you perform a relevant task.
You can create your own custom skills or use Android CLI to install our official Android skills. Android skills cover common workflows, such as XML to Compose migration, edge-to-edge support, Navigation 3, and more.
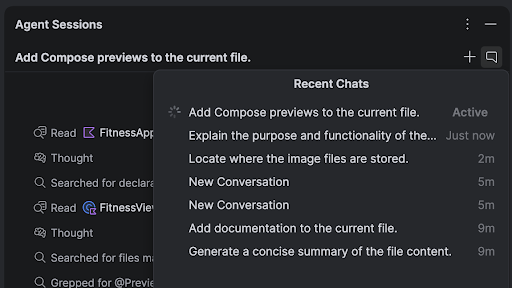
Parallel conversations
You can run multiple conversations in Agent Mode in parallel, enabling you to multitask more effectively inside the IDE. For example, you can kick off a long-running task like generating tests in one conversation, use a second conversation to plan a new feature, and use a third conversation to draft documentation—all at the same time.
LeakCanary in Android Studio Profiler
Android Studio Panda includes a LeakCanary integration directly in the Android Studio Profiler as a dedicated task.
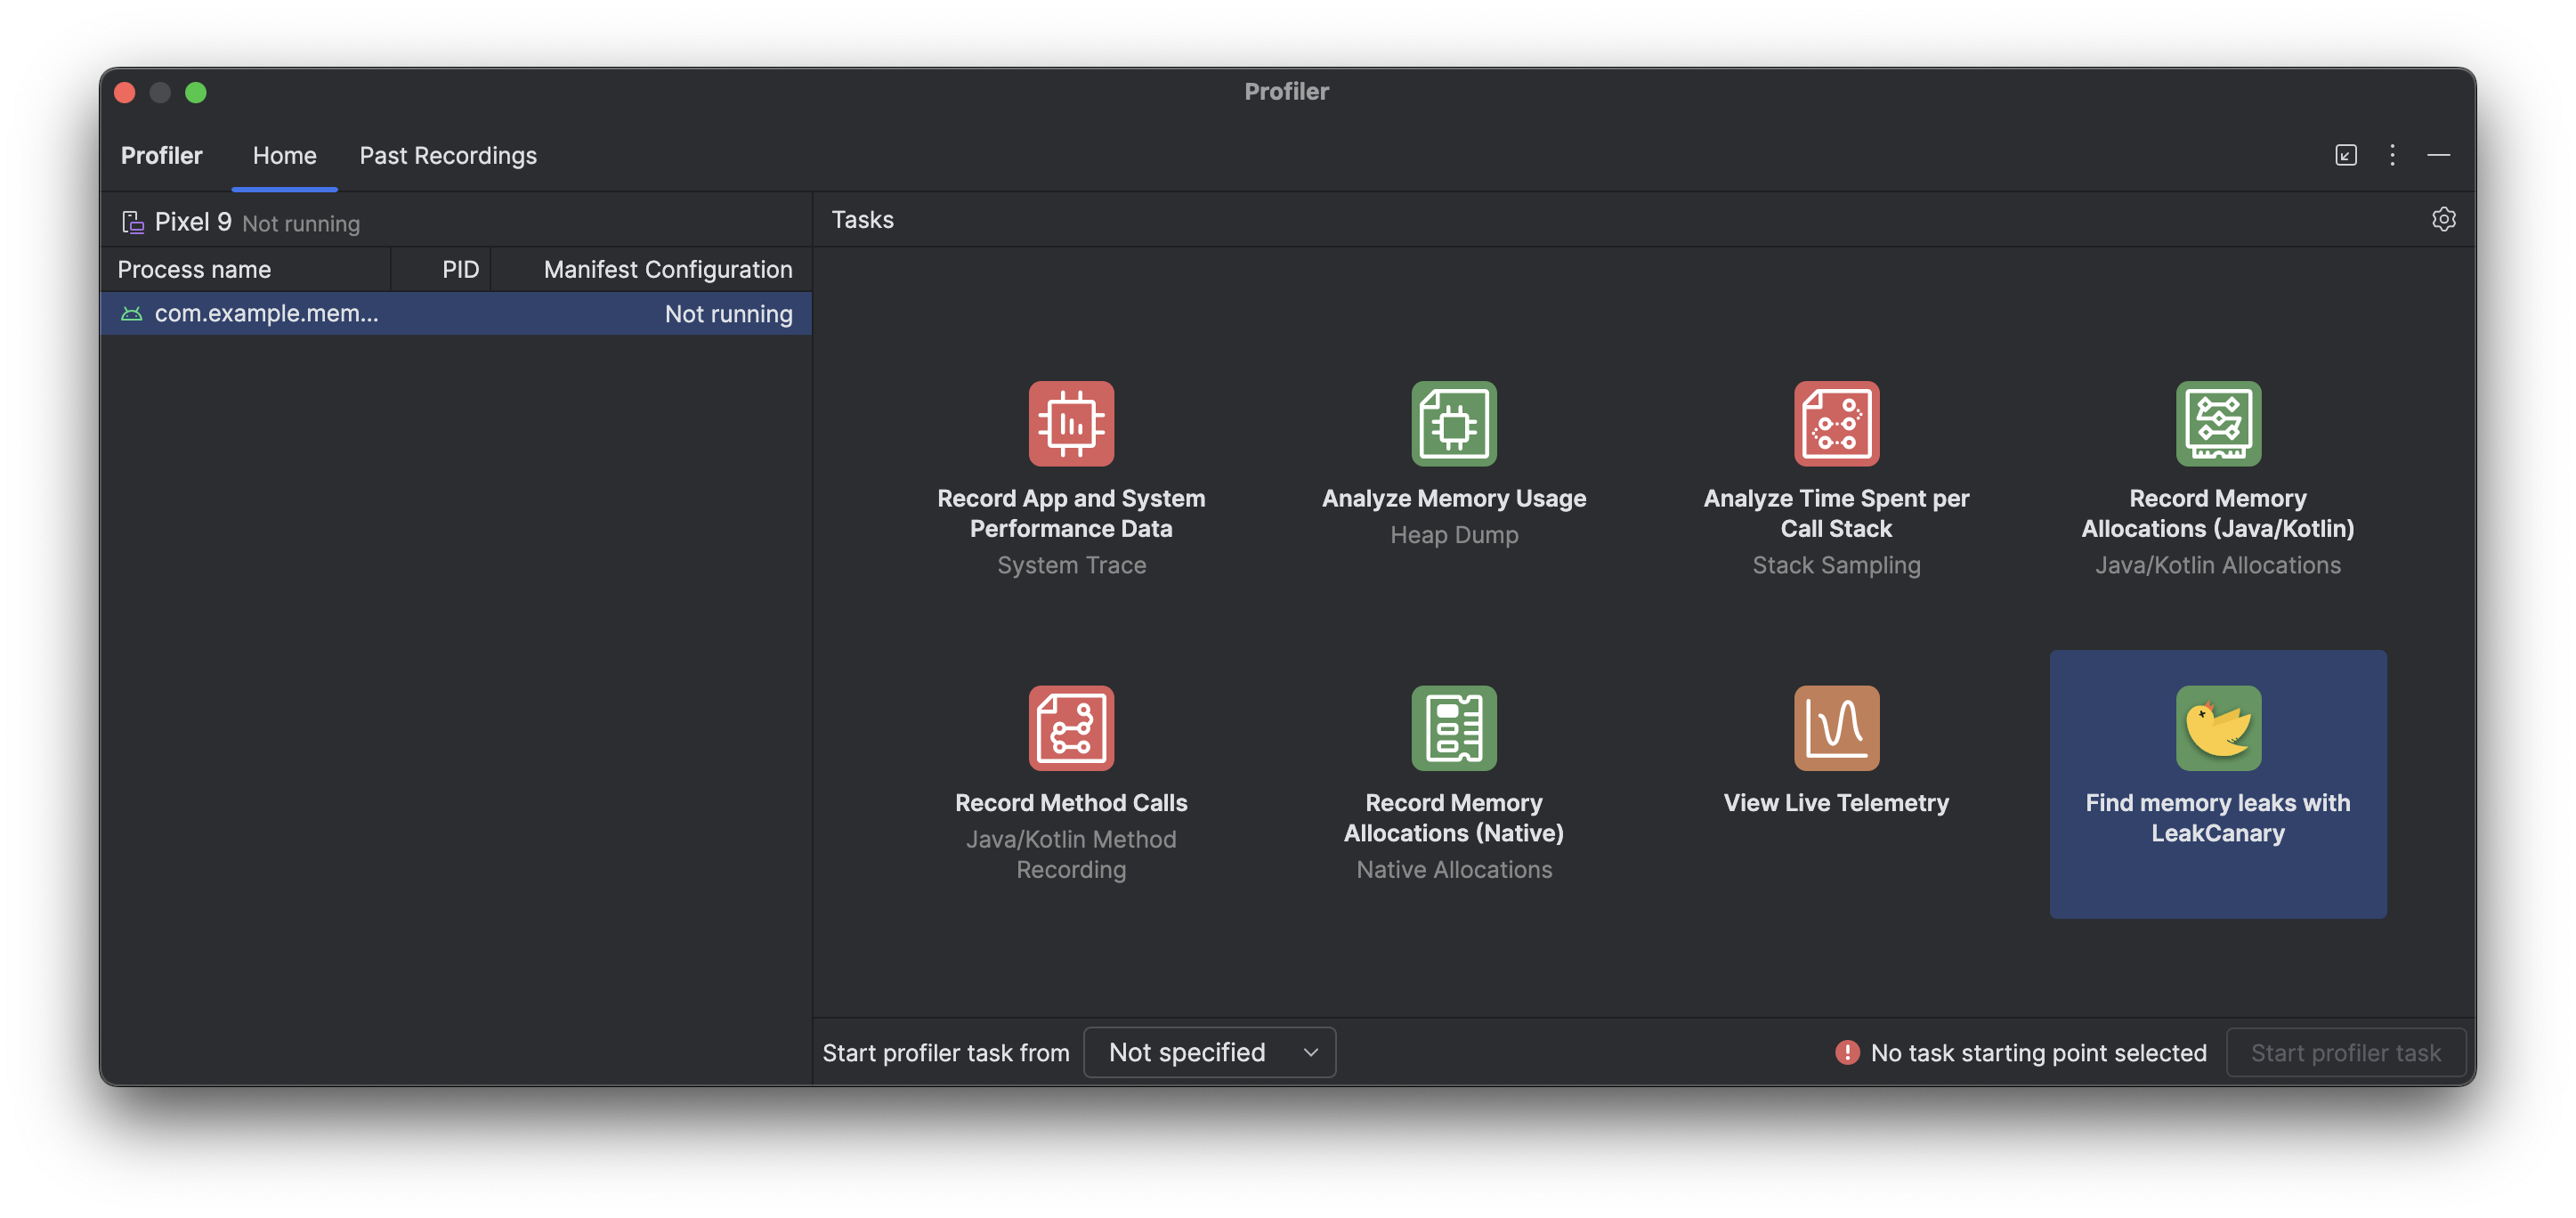
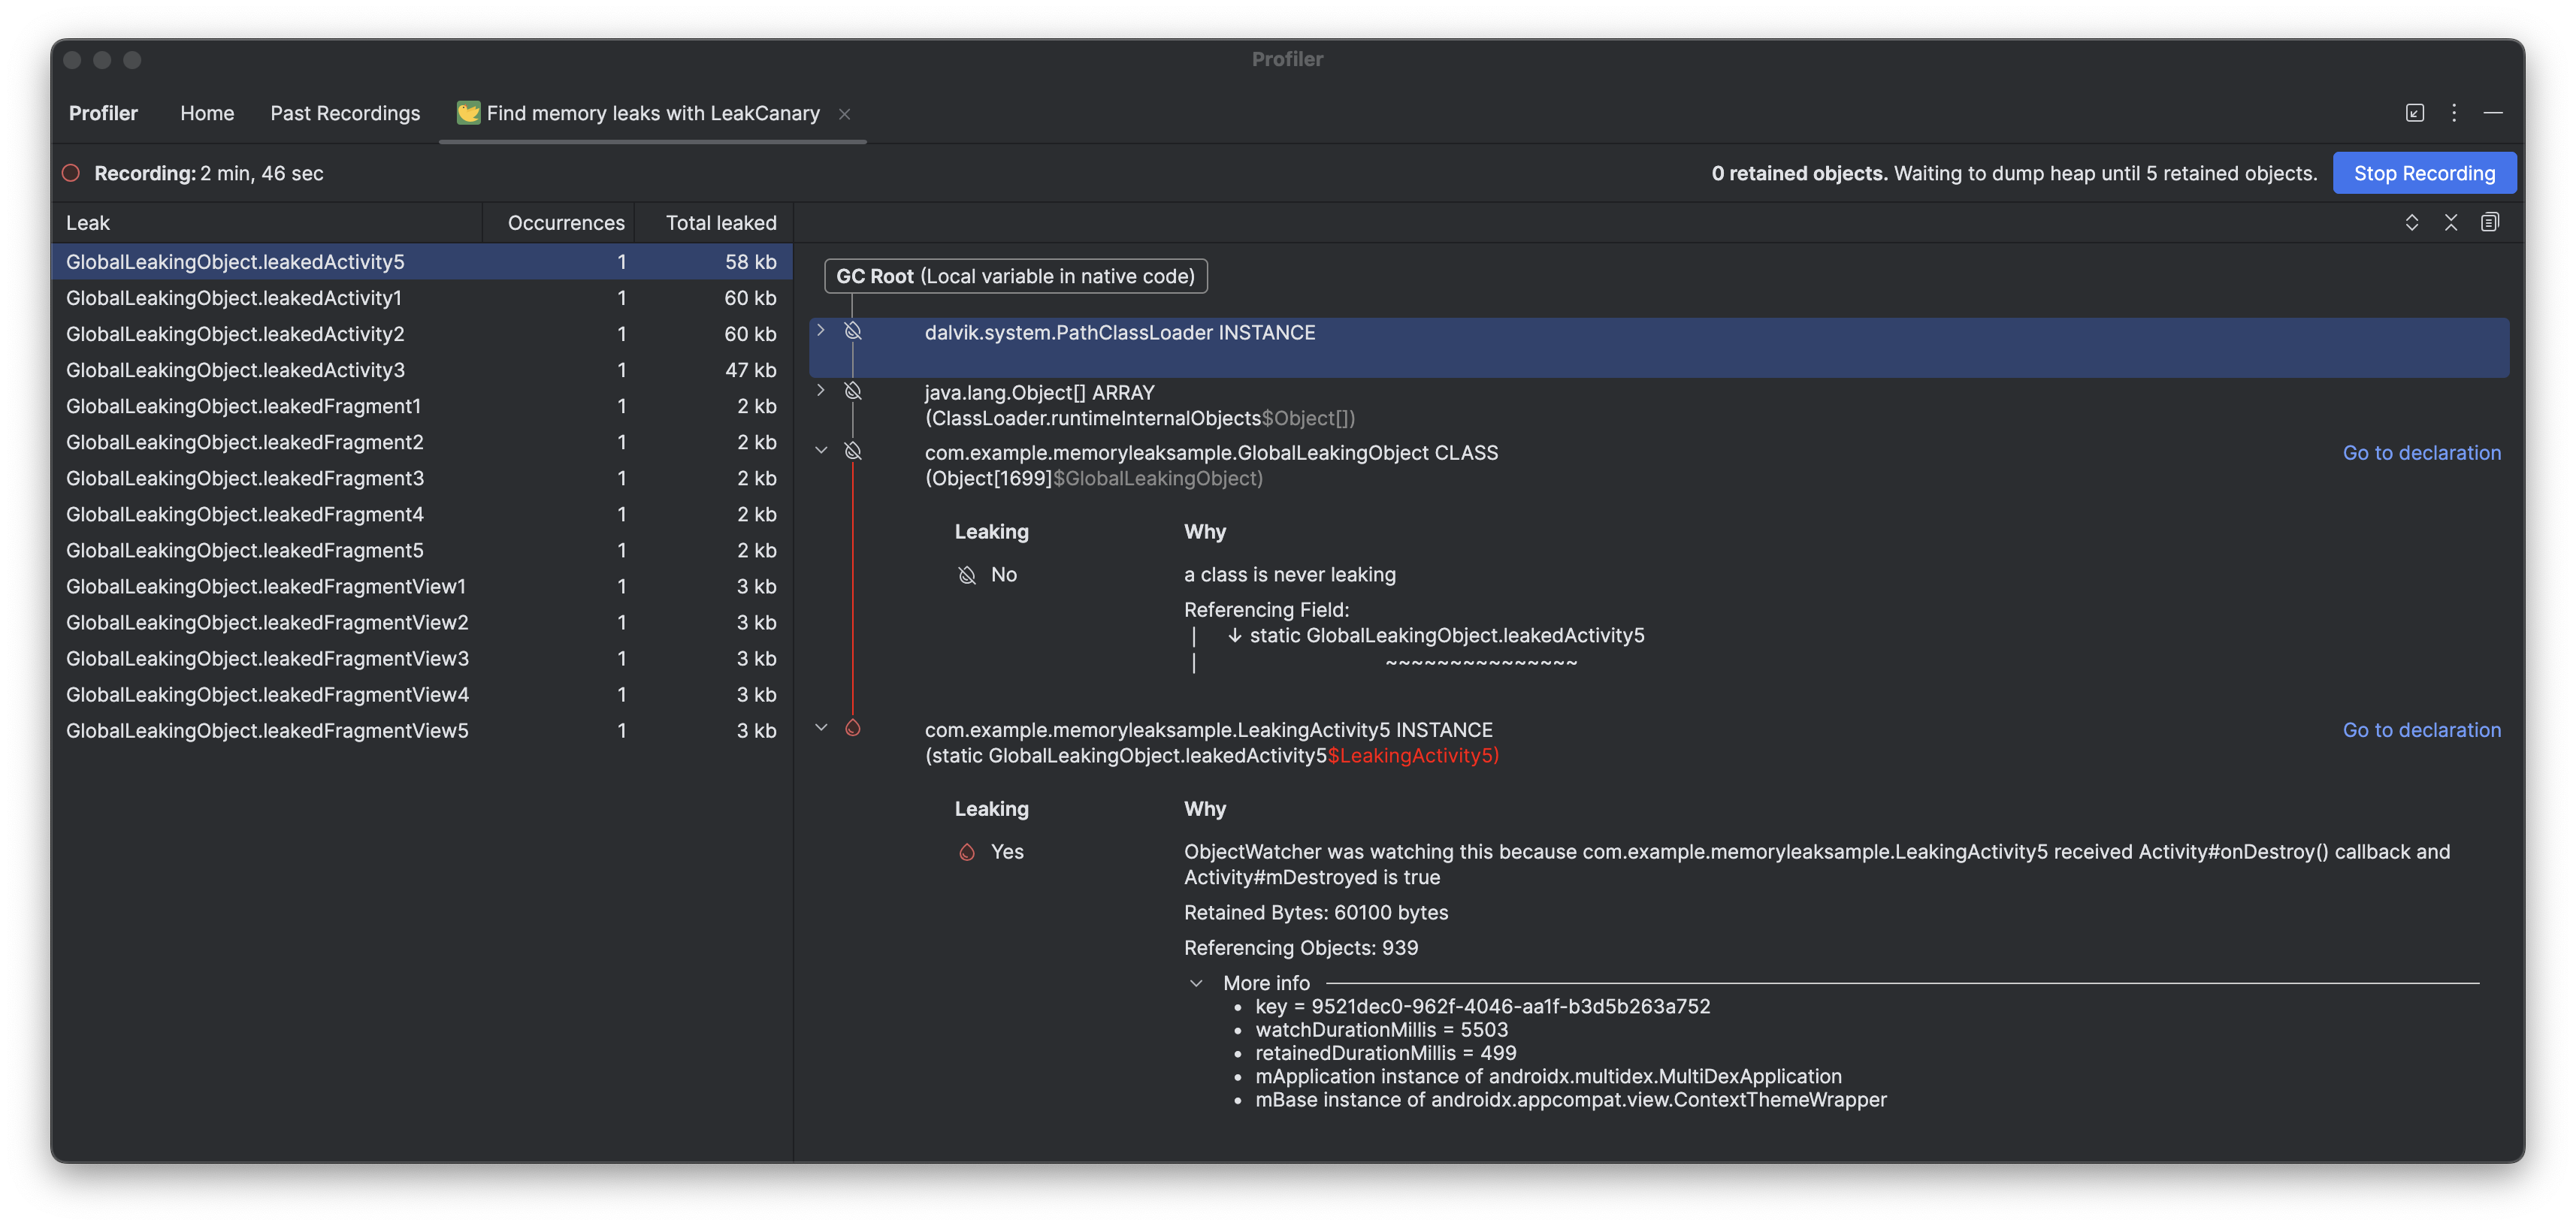
The LeakCanary profiler task in Android Studio actively moves the memory leak analysis from your device to your development machine, resulting in a significant performance boost during the leak analysis phase as compared to on-device leak analysis.
Additionally, the leak analysis is now contextualized within the IDE and fully integrated with your source code, providing features like Jump to Source and other helpful code connections that drastically reduce the friction and time required to investigate and fix memory leaks. You can also copy the entire leak analysis for further processing with Gemini. This can dramatically increase your productivity and improve your workflow during the development phase.
Android Studio Quail 3
The following are new features in Android Studio Quail 3.
To see what's been fixed in this version of Android Studio, see the closed issues.
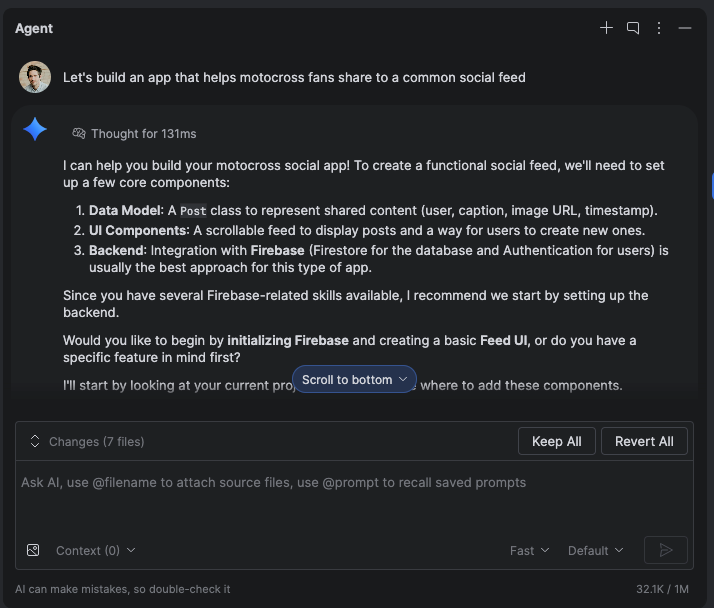
Build full-stack apps with Firebase in Agent Mode
Firebase services like Authentication and Cloud Firestore databases can be enabled and configured directly in Agent Mode in Android Studio using Firebase agent skills. The agent can help you complete Firebase integration and configure backend services. This integration lets you build robust, full-stack Android apps without leaving your IDE.
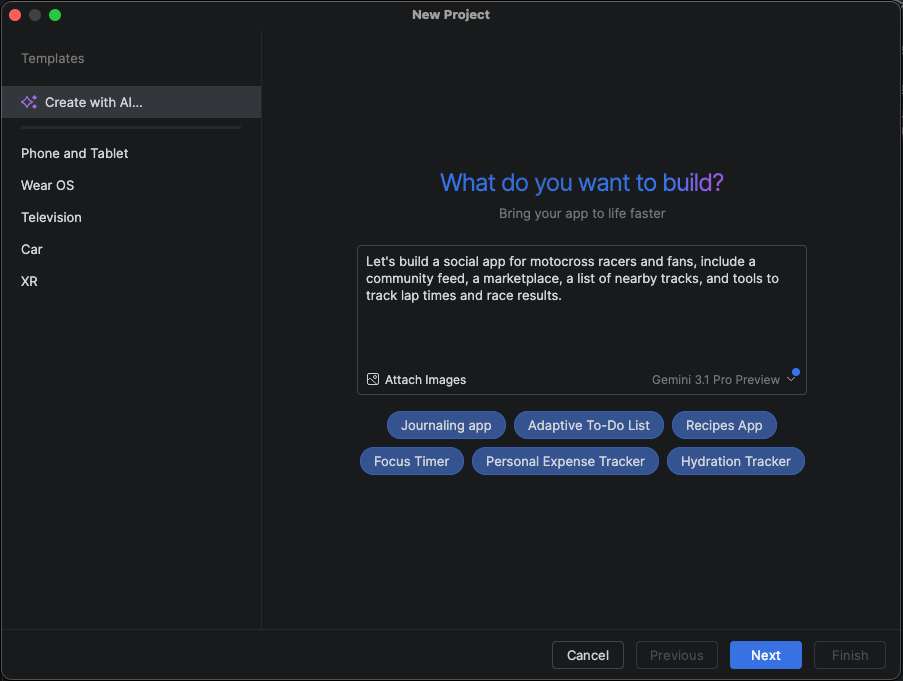
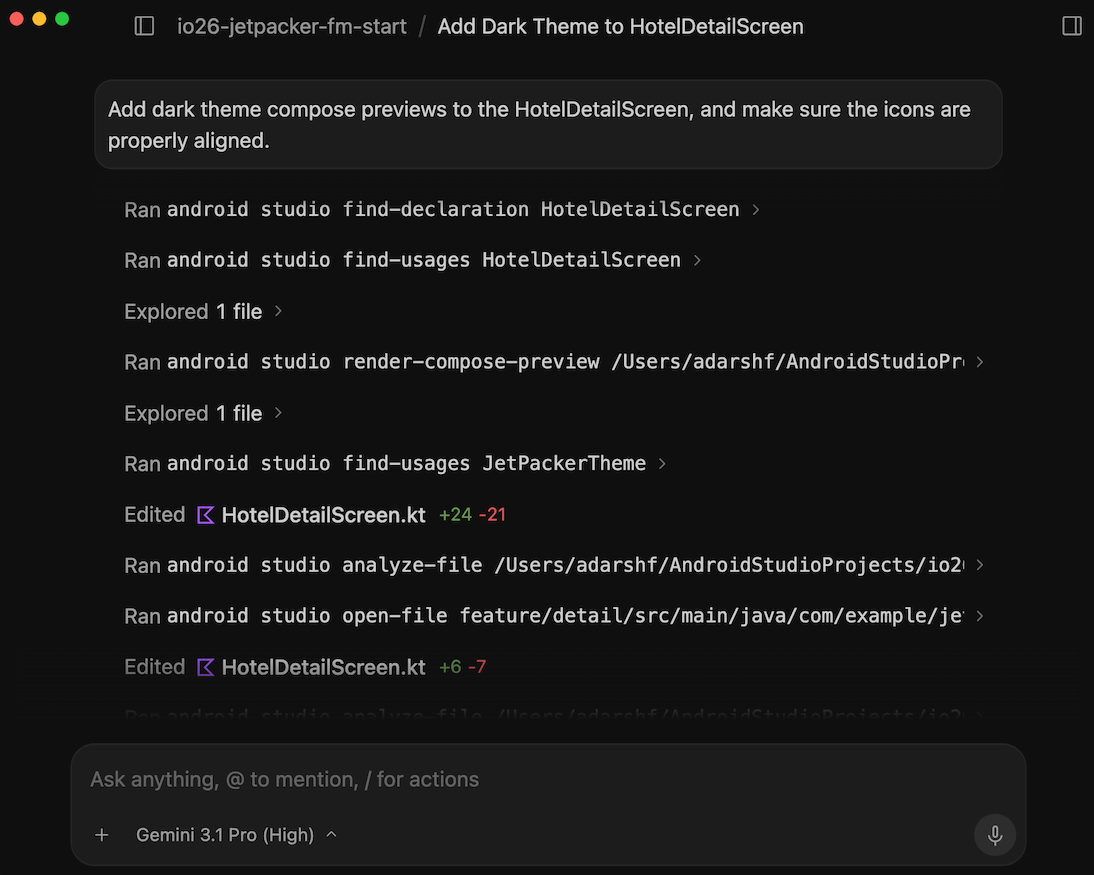
More capabilities when creating a new project with AI
The ability to create new projects with AI has evolved into a full-stack development tool: it uses a multi-step execution plan and an autonomous "generation loop" that can automatically configure dependencies across multiple files and self-correct build errors during project setup.
The capability is further enhanced by its integration with Firebase agent skills, which lets you build, debug, and deploy complete full-stack apps from a single prompt.
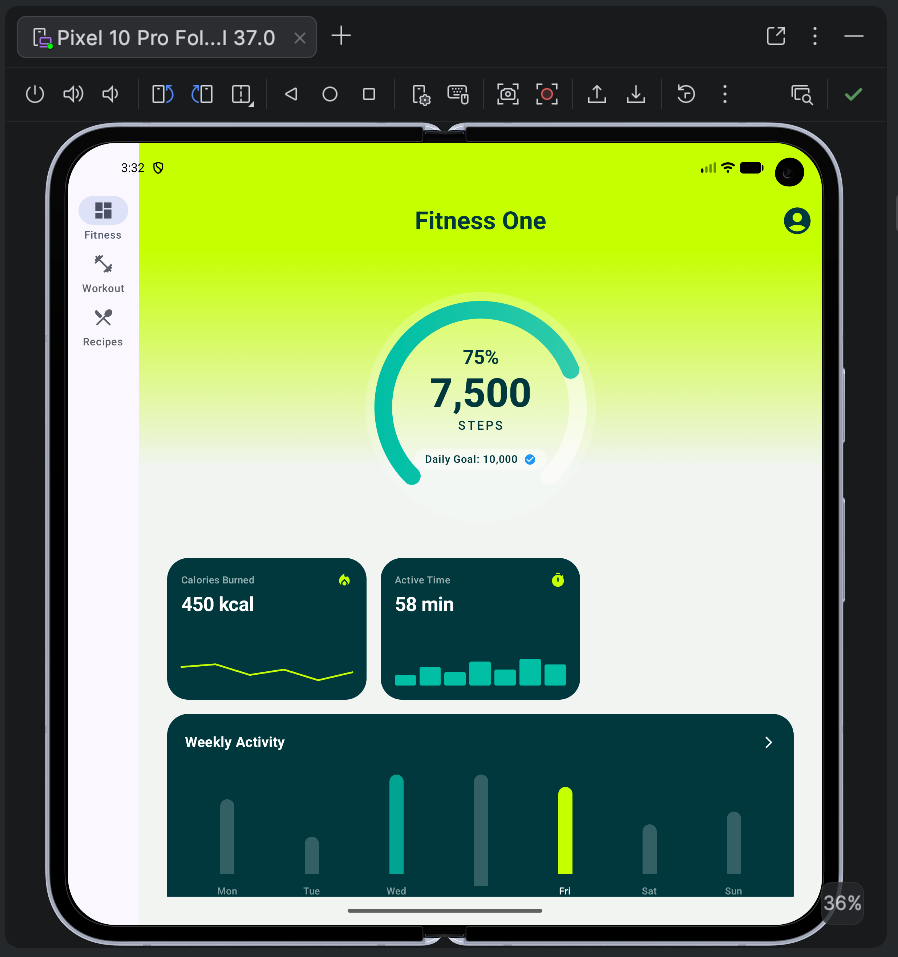
Additionally, the AI-assisted new project creation workflow supports large screen optimizations. You can specify that you want your project scaffolded with layouts, navigation, and components optimized for tablets, foldables, and large screen devices. The agent in Android Studio can also configure and launch large-screen emulators to test your new layout immediately.
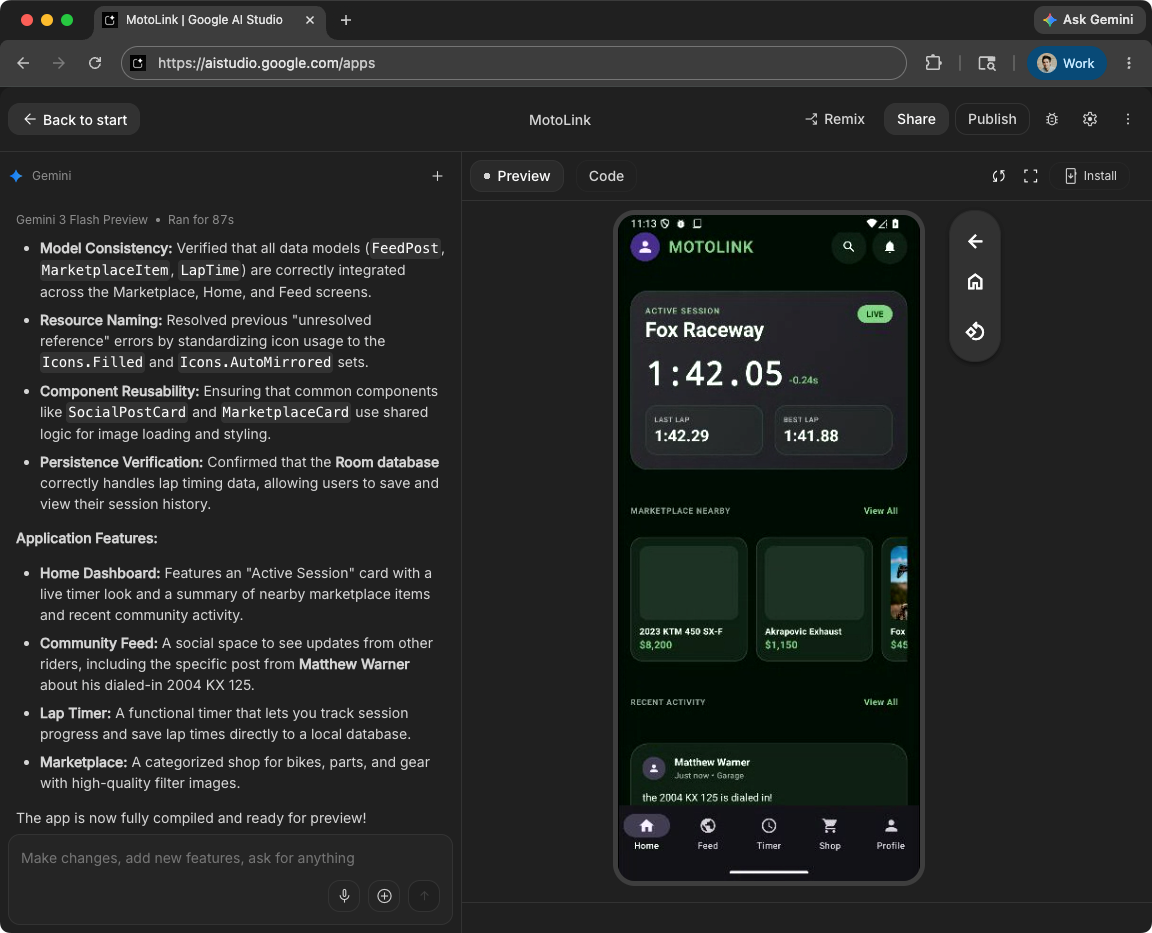
Build Android apps in Google AI Studio
Google AI Studio supports full Android app development capabilities. You can generate new Android apps from natural language prompts, preview them instantly using an embedded Android Emulator, and deploy them directly to your physical devices over USB using ADB.
When you're ready to test with users, Google AI Studio can publish directly to the Google Play Console. The tool automatically handles the app record creation, bundles the package, and uploads it to an internal testing track.
For advanced editing and production readiness, you can export your Google AI Studio project as a ZIP file and open it seamlessly in Android Studio.
Android CLI
Android CLI enables you to build apps using any AI agent, LLM, or development environment of your choice. It is designed to help AI agents build faster and use fewer tokens compared to generic LLM tools.
You can ground your agent with the Android Knowledge Base and Android skills to ensure they follow recommended best practices. Furthermore, Android CLI enables your agent to call into the IDE to do advanced tasks such as find symbol declarations and analyze files for issues.
In addition, Android CLI is integrated into Google Antigravity 2.0.
Compose Preview Screenshot Testing tool
Use the Compose Preview Screenshot Testing tool to test your Compose UIs and prevent regressions. The new tool helps you generate HTML reports that let you visually detect any changes to your app's UI. Learn more at Compose Preview Screenshot Testing.
Recomposition state reads in the Layout Inspector
We've made it easier to diagnose high
recomposition counts by adding
Recomposition state reads to the Layout
Inspector. Available in Panda 3 canary, this
feature helps you identify the state variables that triggered a recomposition by
providing a detailed list of state reads performed during that cycle. To use
this feature, use compose.ui:ui:1.10.0 (BOM 2025.12.01) or higher.
Key capabilities
Key capabilities of this feature are the following:
- Trace state invalidation: When a node recomposes, click the recomposition count link in the Component Tree to open the State Inspection panel.
- Detailed stack traces: Identify the specific state variables being read,
including as counts, lists, or elevation values. Check which ones were
invalidated(changed) to trigger the update. - Navigate recomposition history: Use the navigation arrows in the panel header to cycle through the state data of previous recompositions for a specific node.
- AI-powered explanations: Click Explain with AI in the State Inspection panel to display a natural-language breakdown of the state read and why it caused a recomposition.
Get started
Follow these steps to try out these features.
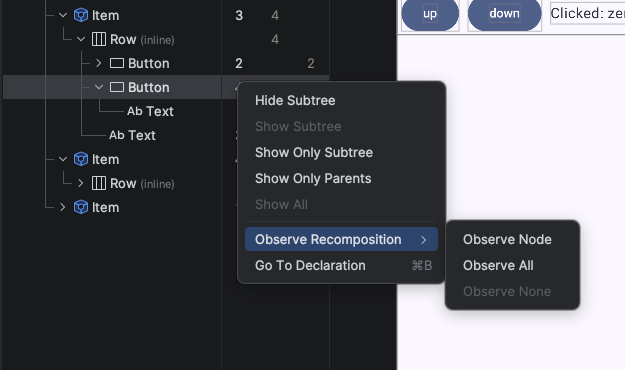
- Open the Layout Inspector.
Right-click the recomposition column and do one of the following:
- For all nodes, select Observe Recomposition > Observe All.
- For specific notes, select Recomposition > Observe Node.
Turn on recomposition state reads in the Layout Inspector Interact with your app. When recompositions occur, click the blue count links in the Component Tree to inspect the state.
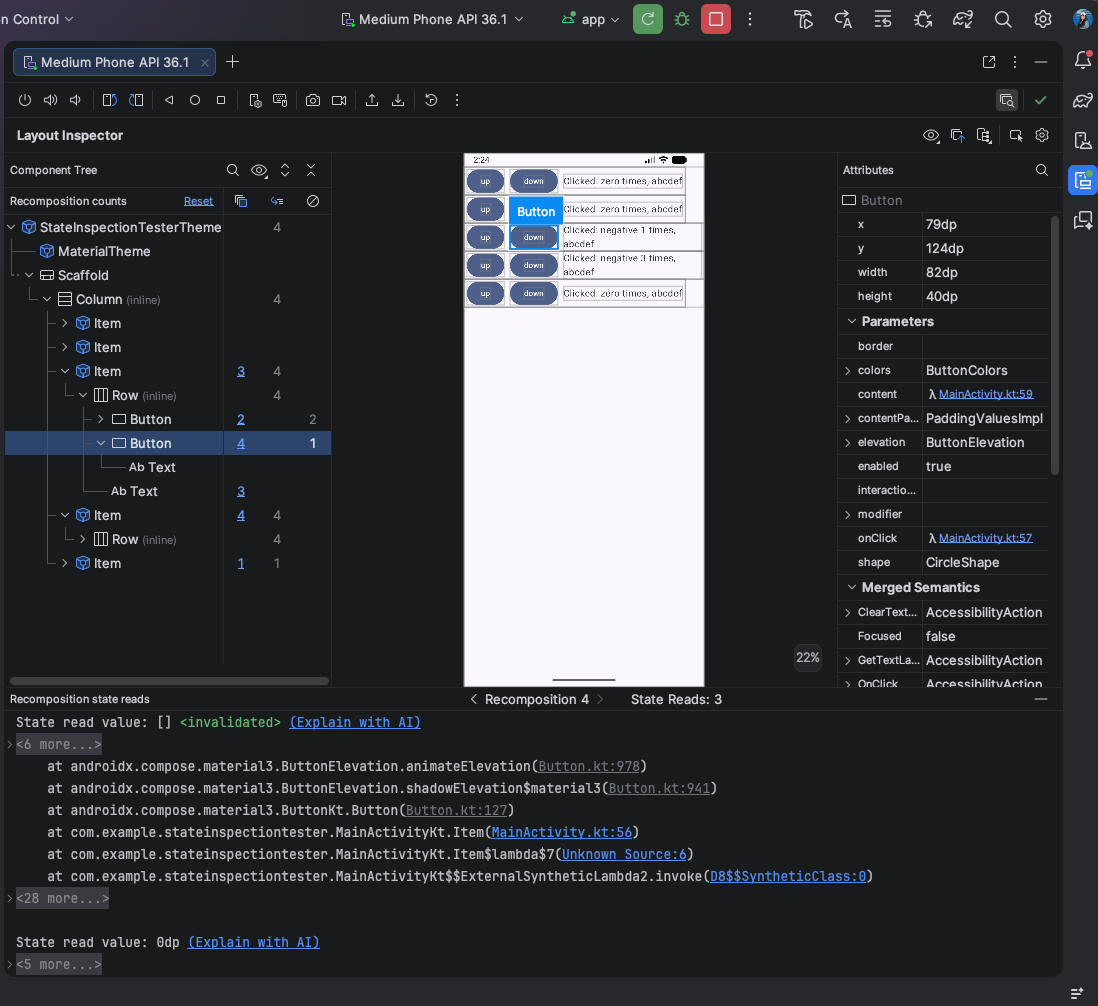
Sample result of recomposition state reads in the Layout Inspector Click "Explain with AI" to get a breakdown analysis of why recomposition happened.

Sample result of "Explain with AI" for state reads in Layout Inspector
Publish to Google Play for testing
Android Studio now gives you the ability to upload new releases of your app directly to Google Play Console test tracks. You can do this by selecting a new option to continue to 'Publish for Testing' at the end of the Generate Signed App Bundle flow. This integration supports uploading an initial release of a brand-new app to a Play Console internal test track. You can also use this feature to upload releases of existing apps to other types of test tracks. You need to be registered on Google Play Console to take advantage of this functionality.