
เราขอแนะนำให้ใช้ Jetpack Macrobenchmark เพื่อทดสอบประสิทธิภาพของแอปเมื่อเปิดใช้ โปรไฟล์พื้นฐาน แล้วเปรียบเทียบผลลัพธ์กับเกณฑ์มาตรฐาน เมื่อปิดใช้ โปรไฟล์พื้นฐาน แนวทางนี้ช่วยให้คุณวัดเวลาเริ่มต้นของแอปได้ ทั้งเวลาในการแสดงผลครั้งแรกและเวลาในการแสดงผลเต็มรูปแบบ หรือประสิทธิภาพการแสดงผลรันไทม์ เพื่อดูว่าเฟรมที่สร้างขึ้นอาจทำให้เกิดอาการกระตุกหรือไม่
Macrobenchmark ช่วยให้คุณควบคุมการคอมไพล์ก่อนการวัดได้โดยใช้ API CompilationMode ใช้ค่า CompilationMode ที่แตกต่างกันเพื่อเปรียบเทียบ
ประสิทธิภาพกับสถานะการคอมไพล์ที่แตกต่างกัน ข้อมูลโค้ดต่อไปนี้แสดงวิธีใช้พารามิเตอร์ CompilationMode เพื่อวัดประโยชน์ของ Baseline
Profiles
@RunWith(AndroidJUnit4ClassRunner::class)
class ColdStartupBenchmark {
    @get:Rule
    val benchmarkRule = MacrobenchmarkRule()

    // No ahead-of-time (AOT) compilation at all. Represents performance of a
    // fresh install on a user's device if you don't enable Baseline Profiles—
    // generally the worst case performance.
    @Test
    fun startupNoCompilation() = startup(CompilationMode.None())

    // Partial pre-compilation with Baseline Profiles. Represents performance of
    // a fresh install on a user's device.
    @Test
    fun startupPartialWithBaselineProfiles() =
        startup(CompilationMode.Partial(baselineProfileMode = BaselineProfileMode.Require))

    // Partial pre-compilation with some just-in-time (JIT) compilation.
    // Represents performance after some app usage.
    @Test
    fun startupPartialCompilation() = startup(
        CompilationMode.Partial(
            baselineProfileMode = BaselineProfileMode.Disable,
            warmupIteration = 3
        )
    )

    // Full pre-compilation. Generally not representative of real user
    // experience, but can yield more stable performance metrics by removing
    // noise from JIT compilation within benchmark runs.
    @Test
    fun startupFullCompilation() = startup(CompilationMode.Full())

    private fun startup(compilationMode: CompilationMode) = benchmarkRule.measureRepeated(
        packageName = "com.example.macrobenchmark.target",
        metrics = listOf(StartupTimingMetric()),
        compilationMode = compilationMode,
        iterations = 10,
        startupMode = StartupMode.COLD,
        setupBlock = {
            pressHome()
        }
    ) {
        uiAutomator {
            startApp(packageName)
            onElement(5_000) { viewIdResourceName == "my-content"}
        }
    }
}
ในภาพหน้าจอต่อไปนี้ คุณจะเห็นผลลัพธ์โดยตรงใน Android Studio สำหรับแอปตัวอย่าง Now in Android ที่ทำงานบน Google Pixel 7 ผลลัพธ์แสดงให้เห็นว่าการเริ่มต้นแอปจะเร็วที่สุดเมื่อใช้ Baseline Profiles (229.0 มิลลิวินาที) เมื่อเทียบกับการไม่คอมไพล์ (324.8 มิลลิวินาที)
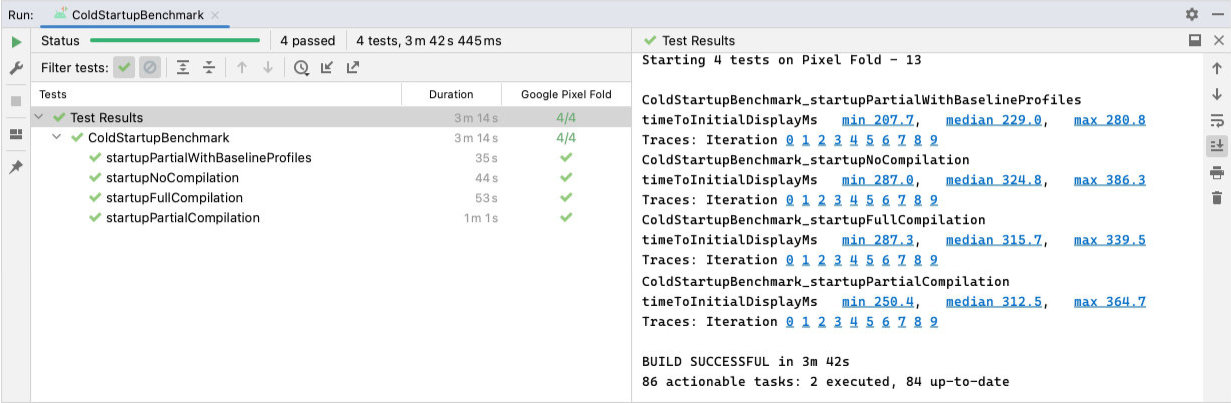
ColdStartupBenchmark
เวลาที่ใช้ในการแสดงผลครั้งแรกเมื่อไม่มีการคอมไพล์ (324 มิลลิวินาที), การคอมไพล์แบบเต็ม
(315 มิลลิวินาที), การคอมไพล์บางส่วน (312 มิลลิวินาที) และโปรไฟล์พื้นฐาน
(229 มิลลิวินาที)แม้ว่าตัวอย่างก่อนหน้าจะแสดงผลการเริ่มต้นแอปที่บันทึกด้วย
StartupTimingMetric แต่ก็ยังมีเมตริกสำคัญอื่นๆ ที่ควรพิจารณา
เช่น FrameTimingMetric ดูข้อมูลเพิ่มเติมเกี่ยวกับเมตริกทุกประเภทได้ที่บันทึกเมตริก Macrobenchmark
เวลาที่ใช้ในการแสดงผลครบถ้วน
ตัวอย่างก่อนหน้าจะวัดเวลาในการแสดงผลครั้งแรก (TTID) ซึ่งเป็น เวลาที่แอปใช้ในการสร้างเฟรมแรก อย่างไรก็ตาม ค่านี้ไม่จำเป็นต้องแสดงเวลาจนกว่าผู้ใช้จะเริ่มโต้ตอบกับแอปได้ เมตริกเวลาจนกว่าจะแสดงผลเต็มรูปแบบ (TTFD) มีประโยชน์มากกว่าในการวัดและ เพิ่มประสิทธิภาพเส้นทางโค้ดที่จำเป็นเพื่อให้แอปอยู่ในสถานะที่ใช้งานได้อย่างเต็มที่
เราขอแนะนำให้เพิ่มประสิทธิภาพทั้ง TTID และ TTFD เนื่องจากทั้ง 2 เมตริกมีความสำคัญ TTID ต่ำ ช่วยให้ผู้ใช้เห็นว่าแอปเปิดตัวจริง การรักษา TTFD ให้สั้นเป็นสิ่งสำคัญที่จะช่วยให้มั่นใจว่าผู้ใช้จะโต้ตอบกับแอป ได้อย่างรวดเร็ว
ดูกลยุทธ์ในการรายงานเมื่อ UI ของแอปวาดเสร็จสมบูรณ์แล้วได้ที่ปรับปรุง ความแม่นยำของเวลาเริ่มต้น
แนะนำสำหรับคุณ
- หมายเหตุ: ข้อความลิงก์จะแสดงเมื่อ JavaScript ปิดอยู่
- [เขียนมาโครเบนช์มาร์ก][11]
- [บันทึกเมตริก Macrobenchmark][12]
- เขียนการทดสอบอัตโนมัติด้วย UI Automator
- [การวิเคราะห์และการเพิ่มประสิทธิภาพการเริ่มต้นแอป {:#app-startup-analysis-optimization}][14]