با مجموعهها، منظم بمانید
ذخیره و طبقهبندی محتوا براساس اولویتهای شما.
توصیه میکنیم از Jetpack Macrobenchmark برای آزمایش عملکرد یک برنامه زمانی که نمایههای خط پایه فعال هستند، استفاده کنید و سپس آن نتایج را با معیاری با نمایههای پایه غیرفعال مقایسه کنید. با این رویکرد، میتوانید زمان راهاندازی برنامه را اندازهگیری کنید - هم زمان تا نمایش اولیه و هم کامل - یا عملکرد رندر زمان اجرا را اندازهگیری کنید تا ببینید آیا فریمهای تولید شده میتوانند باعث jank شوند یا خیر.
ماکرو بنچمارک ها به شما امکان می دهند با استفاده از CompilationMode API کامپایل پیش اندازه گیری را کنترل کنید. از مقادیر مختلف CompilationMode برای مقایسه عملکرد با حالت های مختلف کامپایل استفاده کنید. قطعه کد زیر نحوه استفاده از پارامتر CompilationMode را برای اندازه گیری مزایای Baseline Profiles نشان می دهد:
@RunWith(AndroidJUnit4ClassRunner::class)classColdStartupBenchmark{@get:RulevalbenchmarkRule=MacrobenchmarkRule()// No ahead-of-time (AOT) compilation at all. Represents performance of a// fresh install on a user's device if you don't enable Baseline Profiles—// generally the worst case performance.@TestfunstartupNoCompilation()=startup(CompilationMode.None())// Partial pre-compilation with Baseline Profiles. Represents performance of// a fresh install on a user's device.@TestfunstartupPartialWithBaselineProfiles()=startup(CompilationMode.Partial(baselineProfileMode=BaselineProfileMode.Require))// Partial pre-compilation with some just-in-time (JIT) compilation.// Represents performance after some app usage.@TestfunstartupPartialCompilation()=startup(CompilationMode.Partial(baselineProfileMode=BaselineProfileMode.Disable,warmupIteration=3))// Full pre-compilation. Generally not representative of real user// experience, but can yield more stable performance metrics by removing// noise from JIT compilation within benchmark runs.@TestfunstartupFullCompilation()=startup(CompilationMode.Full())privatefunstartup(compilationMode:CompilationMode)=benchmarkRule.measureRepeated(packageName="com.example.macrobenchmark.target",metrics=listOf(StartupTimingMetric()),compilationMode=compilationMode,iterations=10,startupMode=StartupMode.COLD,setupBlock={pressHome()}){// Waits for the first rendered frame, which represents time to initial display.startActivityAndWait()// Waits for content to be visible, which represents time to fully drawn.device.wait(Until.hasObject(By.res("my-content")),5_000)}}
در تصویر زیر، میتوانید نتایج را مستقیماً در برنامه Android Studio برای Now in Android که در Google Pixel 7 اجرا میشود، مشاهده کنید. نتایج نشان میدهد که راهاندازی برنامه هنگام استفاده از نمایههای خط پایه ( 229.0 میلیثانیه ) سریعترین سرعت را در مقابل بدون کامپایل ( 324.8 میلیثانیه ) دارد.
شکل 1. نتایج 
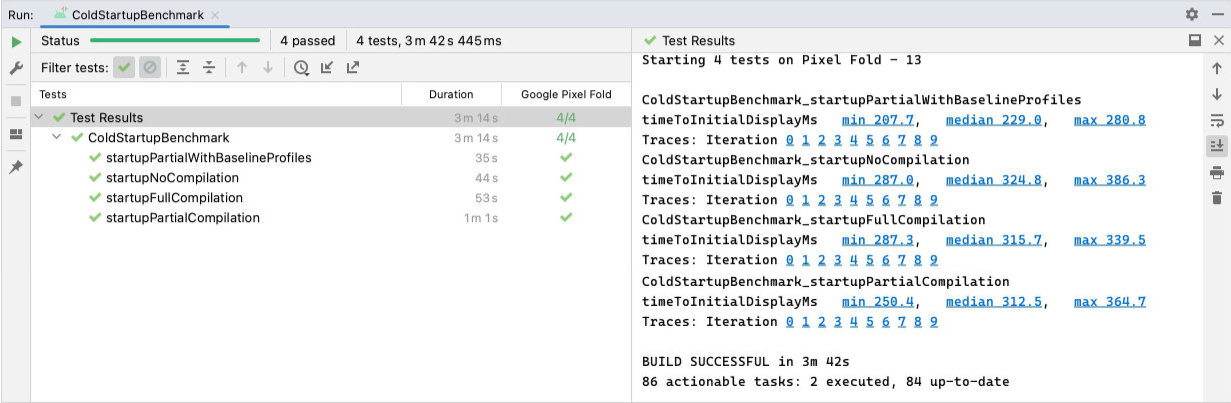
ColdStartupBenchmark که زمان نمایش اولیه را برای عدم کامپایل (324 میلی ثانیه)، کامپایل کامل (315 میلی ثانیه)، کامپایل جزئی (312 میلی ثانیه)، و پروفایل های پایه (229 میلی ثانیه) نشان می دهد.
مثال قبلی زمان نمایش اولیه (TTID) را اندازه گیری می کند، که زمان صرف شده توسط برنامه برای تولید اولین فریم است. با این حال، این لزوماً نشاندهنده زمانی نیست که کاربر بتواند با برنامه شما تعامل برقرار کند. متریک زمان برای نمایش کامل (TTFD) در اندازه گیری و بهینه سازی مسیرهای کد لازم برای داشتن یک وضعیت برنامه کاملاً قابل استفاده مفیدتر است.
ما بهینه سازی را برای TTID و TTFD توصیه می کنیم، زیرا هر دو مهم هستند. TTID پایین به کاربر کمک می کند تا ببیند برنامه واقعاً در حال راه اندازی است. کوتاه نگه داشتن TTFD برای اطمینان از اینکه کاربر می تواند به سرعت با برنامه تعامل داشته باشد، مهم است.
برای استراتژیهای مربوط به گزارشدهی زمانی که رابط کاربری برنامه کاملاً ترسیم شده است، به بهبود دقت زمانبندی راهاندازی مراجعه کنید.
{% کلمه به کلمه %} {% آخر کلمه %}
برای شما توصیه می شود
توجه: وقتی جاوا اسکریپت خاموش است، متن پیوند نمایش داده می شود
[نوشتن یک ماکرو بنچمارک][11]
[گرفتن معیارهای ماکرو بنچمارک][12]
[تحلیل و بهینهسازی راهاندازی برنامه {:#app-startup-analysis-optimization}][13]
محتوا و نمونه کدها در این صفحه مشمول پروانههای توصیفشده در پروانه محتوا هستند. جاوا و OpenJDK علامتهای تجاری یا علامتهای تجاری ثبتشده Oracle و/یا وابستههای آن هستند.
تاریخ آخرین بهروزرسانی 2025-08-27 بهوقت ساعت هماهنگ جهانی.
[[["درک آسان","easyToUnderstand","thumb-up"],["مشکلم را برطرف کرد","solvedMyProblem","thumb-up"],["غیره","otherUp","thumb-up"]],[["اطلاعاتی که نیاز دارم وجود ندارد","missingTheInformationINeed","thumb-down"],["بیشازحد پیچیده/ مراحل بسیار زیاد","tooComplicatedTooManySteps","thumb-down"],["قدیمی","outOfDate","thumb-down"],["مشکل ترجمه","translationIssue","thumb-down"],["مشکل کد / نمونهها","samplesCodeIssue","thumb-down"],["غیره","otherDown","thumb-down"]],["تاریخ آخرین بهروزرسانی 2025-08-27 بهوقت ساعت هماهنگ جهانی."],[],[],null,["We recommend using [Jetpack Macrobenchmark](/topic/performance/benchmarking/macrobenchmark-overview) to test how an app performs when\nBaseline Profiles are enabled, and then compare those results to a benchmark\nwith Baseline Profiles disabled. With this approach, you can measure app startup\ntime---both time to initial and full display---or runtime rendering\nperformance to see if the frames produced can cause jank.\n\nMacrobenchmarks let you control pre-measurement compilation using the\n[`CompilationMode`](/reference/androidx/benchmark/macro/CompilationMode) API. Use different `CompilationMode` values to compare\nperformance with different compilation states. The following code snippet shows\nhow to use the `CompilationMode` parameter to measure the benefit of Baseline\nProfiles: \n\n```kotlin\n@RunWith(AndroidJUnit4ClassRunner::class)\nclass ColdStartupBenchmark {\n @get:Rule\n val benchmarkRule = MacrobenchmarkRule()\n\n // No ahead-of-time (AOT) compilation at all. Represents performance of a\n // fresh install on a user's device if you don't enable Baseline Profiles---\n // generally the worst case performance.\n @Test\n fun startupNoCompilation() = startup(CompilationMode.None())\n\n // Partial pre-compilation with Baseline Profiles. Represents performance of\n // a fresh install on a user's device.\n @Test\n fun startupPartialWithBaselineProfiles() =\n startup(CompilationMode.Partial(baselineProfileMode = BaselineProfileMode.Require))\n\n // Partial pre-compilation with some just-in-time (JIT) compilation.\n // Represents performance after some app usage.\n @Test\n fun startupPartialCompilation() = startup(\n CompilationMode.Partial(\n baselineProfileMode = BaselineProfileMode.Disable,\n warmupIteration = 3\n )\n )\n\n // Full pre-compilation. Generally not representative of real user\n // experience, but can yield more stable performance metrics by removing\n // noise from JIT compilation within benchmark runs.\n @Test\n fun startupFullCompilation() = startup(CompilationMode.Full())\n\n private fun startup(compilationMode: CompilationMode) = benchmarkRule.measureRepeated(\n packageName = \"com.example.macrobenchmark.target\",\n metrics = listOf(StartupTimingMetric()),\n compilationMode = compilationMode,\n iterations = 10,\n startupMode = StartupMode.COLD,\n setupBlock = {\n pressHome()\n }\n ) {\n // Waits for the first rendered frame, which represents time to initial display.\n startActivityAndWait()\n\n // Waits for content to be visible, which represents time to fully drawn.\n device.wait(Until.hasObject(By.res(\"my-content\")), 5_000)\n }\n}\n```\n| **Caution:** Run the benchmarks on a physical device to measure real world performance. Measuring performance on an Android emulator likely provides incorrect results, because resources are shared with its hosting machine.\n\nIn the following screenshot, you can see the results directly in Android Studio\nfor the [Now in Android sample](https://goo.gle/nia) app ran on Google Pixel 7. The\nresults show that app startup is fastest when using Baseline Profiles\n(**229.0ms** ) in contrast with no compilation (**324.8ms**).\n**Figure 1.** Results of `ColdStartupBenchmark` showing time to initial display for no compilation (324ms), full compilation (315ms), partial compilation (312ms), and Baseline Profiles (229ms). **Tip:** You can also retrieve the results as a JSON file to parse them as part of your CI pipeline. For more information, see [Benchmarking in CI](/topic/performance/benchmarking/benchmarking-in-ci).\n\nWhile the previous example shows app startup results captured with\n[`StartupTimingMetric`](/reference/androidx/benchmark/macro/StartupTimingMetric), there are other important metrics worth considering,\nsuch as [`FrameTimingMetric`](/reference/androidx/benchmark/macro/FrameTimingMetric). For more information about all the types of\nmetrics, see [Capture Macrobenchmark metrics](/topic/performance/benchmarking/macrobenchmark-metrics).\n\nTime to full display\n\nThe previous example measures the [time to initial display](/topic/performance/vitals/launch-time#time-initial) (TTID), which is\nthe time taken by the app to produce its first frame. However, this doesn't\nnecessarily reflect the time until the user can start interacting with your app.\nThe [time to full display](/topic/performance/vitals/launch-time#time-full) (TTFD) metric is more useful in measuring and\noptimizing the code paths necessary to have a fully useable app state.\n\nWe recommend optimizing for both TTID and TTFD, as both are important. A low\nTTID helps the user see that the app is actually launching. Keeping the TTFD\nshort is important to help ensure that the user can interact with the app\nquickly.\n\nFor strategies on reporting when the app UI is fully drawn, see [Improve\nstartup timing accuracy](/topic/performance/benchmarking/macrobenchmark-metrics#startup-accuracy).\n\nRecommended for you\n\n- Note: link text is displayed when JavaScript is off\n- \\[Write a Macrobenchmark\\]\\[11\\]\n- \\[Capture Macrobenchmark metrics\\]\\[12\\]\n- \\[App startup analysis and optimization {:#app-startup-analysis-optimization}\\]\\[13\\]"]]