
Larger projects, or those that implement a lot of custom build logic, may
require you to take a deeper look into the build process to find bottlenecks.
You can do that by profiling how long Gradle takes to execute each phase of
the build lifecycle and each build task. For example, if your build profile
shows that Gradle is spending too much time configuring your project, it may
suggest that you need to
move custom build logic out of the configuration phase.
Additionally, if the mergeDevDebugResources task consumes a large amount
of the build time, it may indicate that you need to either
convert your images to WebP
or disable PNG crunching.
If you're using Android Studio 4.0 or higher, the best way to investigate build performance issues is by using the Build Analyzer.
In addition, there are two options for profiling your build outside of Android Studio:
The standalone
gradle-profilertool, a robust tool for deep analysis of your build.The Gradle
--profileoption, a convenient tool available from the Gradle command line.
Using the standalone gradle-profiler tool
In order to find the project setup that provides you with the best build speed, you should use Gradle profiler, a tool for gathering profiling and benchmarking information for Gradle builds. Gradle profiler allows you to create build scenarios and run them multiple times, preventing high variance between results and ensuring reproducibility of the results.
Benchmarking mode should be used to collect information about clean and incremental builds, while profiling mode can be used to collect more granular information about the runs, including CPU snapshots.
Some of the project setup configurations for benchmarking include:
- Plugin versions
- Gradle versions
- JVM settings (heap size, permgen size, garbage collection, etc.)
- Number of Gradle workers (
org.gradle.workers.max) - Per-plugin options to further optimize performance
Getting started
- Install gradle-profiler by following these instructions
- Run:
gradle-profiler --benchmark --project-dir <root-project> :app:assembleDebug
This will benchmark a fully up-to-date build because --benchmark runs the
task multiple times without changing the project in between. Then it will
generate an HTML report under the profile-out/ directory showing you the
build times.
There are other scenarios that may be more useful to benchmark:
- Code changes in a method body in a class where you do most of your work.
- API changes in a module that's used throughout your project. While less frequent than changes to your own code, this has a bigger impact and it's useful to measure it.
- Layout edits to simulate iterating on UI work.
- String edits to simulate dealing with translation work.
- Clean builds to simulate changes to the build itself (e.g., Android Gradle
plugin update, Gradle update, or edits to your own build code
under
buildSrc).
In order to benchmark these use cases, you can create a scenario that will be
used to drive the gradle-profiler execution and which applies appropriate
changes to your sources. You can examine some of the common scenarios below.
Profiling different memory/CPU settings
In order to benchmark different memory and CPU settings, you can create
multiple scenarios which use different values for org.gradle.jvmargs. For
example, you can create scenarios:
# <root-project>/scenarios.txt
clean_build_2gb_4workers {
    tasks = [":app:assembleDebug"]
    gradle-args = ["--max-workers=4"]
    jvm-args = ["-Xmx2048m"]
    cleanup-tasks = ["clean"]
}
clean_build_parallelGC {
    tasks = [":app:assembleDebug"]
    jvm-args = ["-XX:+UseParallelGC"]
    cleanup-tasks = ["clean"]
}

clean_build_G1GC_4gb {
    tasks = [":app:assembleDebug"]
    jvm-args = ["-Xmx4096m", "-XX:+UseG1GC"]
    cleanup-tasks = ["clean"]
}
Running gradle-profiler --benchmark --project-dir <root-project> --scenario-file scenarios.txt
will run three scenarios, and you'll be able to compare how long
:app:assembleDebug takes for each of these setups.
Profiling different Gradle plugin versions
In order to find out how changing the version of the Gradle plugin impacts build times, create a scenario for benchmarking that. This requires some preparation to make the plugin version injectable from the scenario. Change your root build.gradle:
# <root-project>/build.gradle
buildscript {
    def agpVersion = providers.systemProperty("agpVersion").forUseAtConfigurationTime().orNull ?: '4.1.0'

    ext.kotlin = providers.systemProperty('kotlinVersion').forUseAtConfigurationTime().orNull ?: '1.4.0'

    dependencies {
        classpath "com.android.tools.build:gradle:$agpVersion"
        classpath "org.jetbrains.kotlin:kotlin-gradle-plugin:$kotlin"
    }
}
Now you can specify the Android Gradle plugin and Kotlin Gradle plugin versions from the scenarios file, and have the scenario add a new method to the source files:
# <root-project>/scenarios.txt
non_abi_change_agp4.1.0_kotlin1.4.10 {
    tasks = [":app:assembleDebug"]
    apply-abi-change-to ["app/src/main/java/com/example/your_app/your_code_file.java,
                              "app/src/main/java/com/example/your_app/your_code_file.kt"]
    System-properties {
      "agpVersion" = "4.1.0"
      "kotlinVersion" = "1.4.10"
}

non_abi_change_agp4.2.0_kotlin1.4.20 {
    tasks = [":app:assembleDebug"]
    apply-abi-change-to ["app/src/main/java/com/example/your_app/your_code_file.java,
                              "app/src/main/java/com/example/your_app/your_code_file.kt"]
    System-properties {
      "agpVersion" = "4.2.0-alpha16"
      "kotlinVersion" = "1.4.20"
}
Profiling an incremental build
The majority of builds are incremental, making this one of the most important scenarios to profile. Gradle profiler has extensive support for profiling incremental builds. It is able to apply changes to a source file automatically by changing a method body, adding a new method, or changing a layout or string resource. For instance, you can create incremental scenarios like this:
# <root-project>/scenarios.txt
non_abi_change {
    tasks = [":app:assembleDebug"]
    apply-non-abi-change-to = ["app/src/main/java/com/example/your_app/your_code_file.java,
                              "app/src/main/java/com/example/your_app/your_code_file.kt"]
}

abi_change {
    tasks = [":app:assembleDebug"]
    apply-abi-change-to = ["app/src/main/java/com/example/your_app/your_code_file.java,
                              "app/src/main/java/com/example/your_app/your_code_file.kt"]
}

layout_change {
    tasks = [":app:assembleDebug"]
    apply-android-layout-change-to = "app/src/main/res/your_layout_file.xml"
}
string_resource_change {
    tasks = [":app:assembleDebug"]
    apply-android-resource-value-change-to = "app/src/main/res/values/strings.xml"
}
Running gradle-profiler --benchmark --project-dir <root-project> --scenario-file scenarios.txt
will generate the HTML report with the benchmarking data.
You can combine incremental scenarios with other settings, like heap size, number of workers, or Gradle version:
# <root-project>/scenarios.txt
non_abi_change_4g {
    tasks = [":app:assembleDebug"]
    apply-non-abi-change-to ["app/src/main/java/com/example/your_app/your_code_file.java,
                              "app/src/main/java/com/example/your_app/your_code_file.kt"]
    jvm-args = ["-Xmx4096m"]
}

non_abi_change_4g_8workers {
    tasks = [":app:assembleDebug"]
    apply-non-abi-change-to ["app/src/main/java/com/example/your_app/your_code_file.java,
                              "app/src/main/java/com/example/your_app/your_code_file.kt"]
    jvm-args = ["-Xmx4096m"]
    gradle-args = ["--max-workers=8"]
}

non_abi_change_3g_gradle67 {
    tasks = [":app:assembleDebug"]
    apply-non-abi-change-to ["app/src/main/java/com/example/your_app/your_code_file.java,
                              "app/src/main/java/com/example/your_app/your_code_file.kt"]
    jvm-args = ["-Xmx3072m"]
    version = ["6.7"]
}
Profiling a clean build
In order to benchmark a clean build, you can create a scenario that will be used to drive the gradle-profiler execution:
# <root-project>/scenarios.txt
clean_build {
    tasks = [":app:assembleDebug"]
    cleanup-tasks = ["clean"]
}
To run this scenario, use the following command:
gradle-profiler --benchmark --project-dir <root-project> --scenario-file scenarios.txt
Using the Gradle --profile option
To generate and view a build profile from the Gradle command line, perform the following steps:
- Open a command-line terminal at the root of your project.
- Perform a clean build by entering the following command. As you profile
your build, you should perform a clean build between each build you profile
because Gradle skips tasks when inputs to a task (such as source code) don't
change. Thus, a second build with no input changes always runs faster because
tasks are not being re-run. So running the
cleantask between your builds ensures that you profile the full build process.// On Mac or Linux, run the Gradle wrapper using "./gradlew". gradlew clean
- Execute a debug build of one of your product flavors, such as the "dev" flavor,
with the following flags:
gradlew --profile --offline --rerun-tasks assembleFlavorDebug
-
--profile: Enables profiling. -
--offline: Disables Gradle from fetching online dependencies. This makes sure than any delays caused by Gradle attempting to update your dependencies don't interfere with your profiling data. You should have already built your project once to make sure Gradle has already downloaded and cached your dependencies. -
--rerun-tasks: Forces Gradle to rerun all tasks and ignore any task optimizations.
-
-
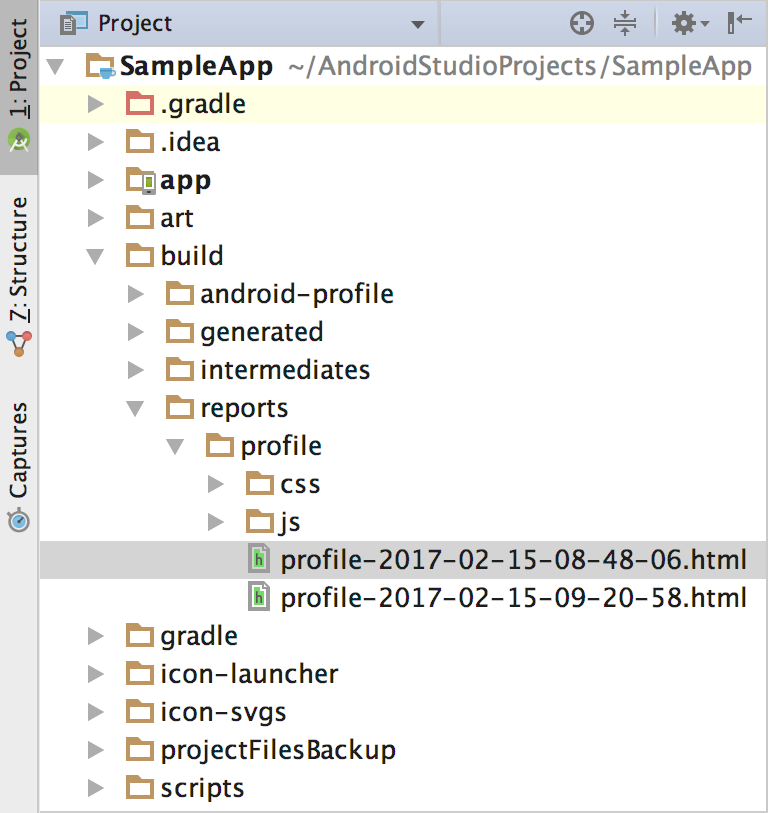
Figure 1. Project view indicating the location of profile reports.
After the build completes, use the Project window navigate to the
project-root/build/reports/profile/directory (as shown in figure 1). -
Right-click the
profile-timestamp.htmlfile and select Open in Browser > Default. The report should look similar to the one shown in figure 2. You can inspect each tab in the report to learn about your build, such as the Task Execution tab which shows how long Gradle took to execute each build task.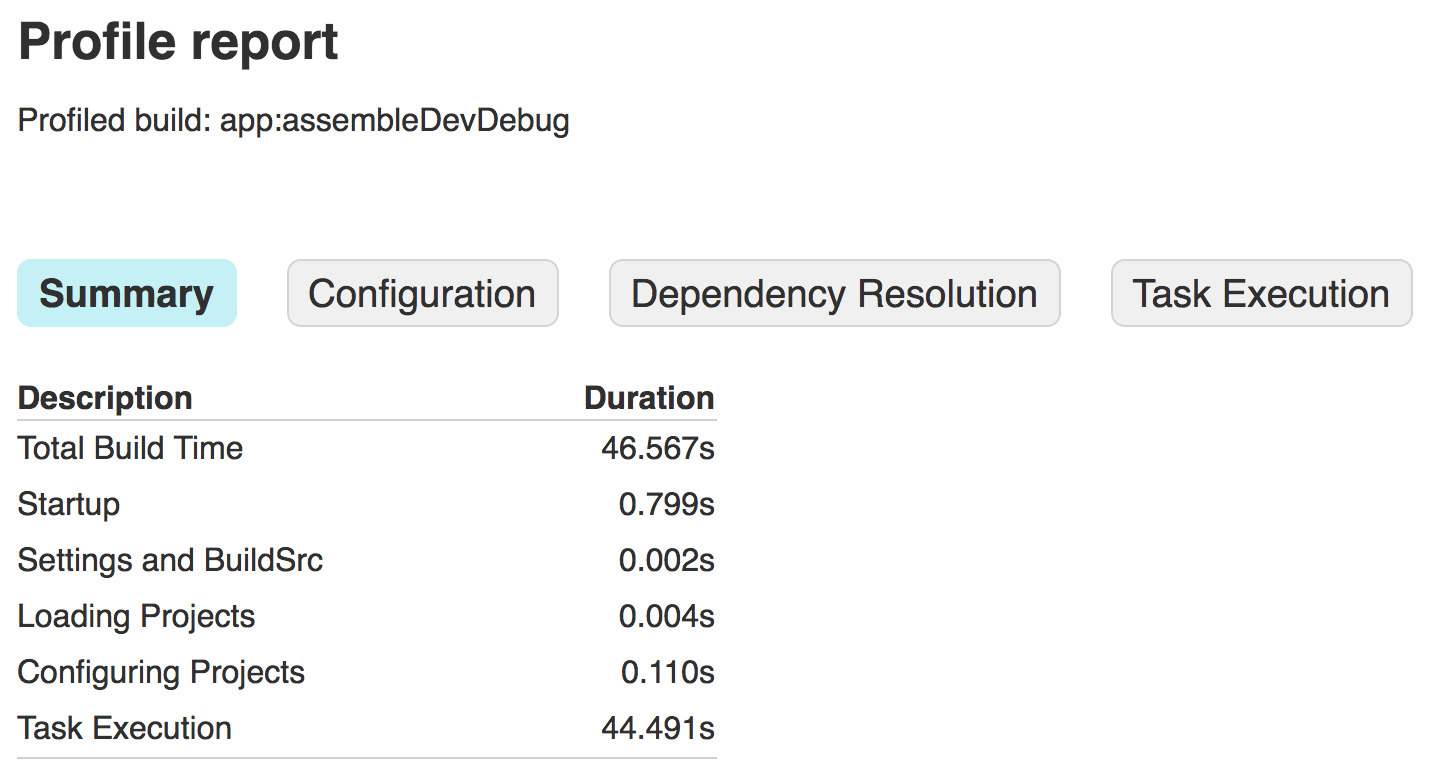
Figure 2. Viewing a report in a browser.
-
Optional: Before making any changes to your project or build configuration, repeat the command in step 3, but omit the
--rerun-tasksflag. Because Gradle attempts to save time by not re-executing tasks whose inputs haven't changed (these are indicated asUP-TO-DATEin the Task Execution tab of the report, as shown in figure 3), you can identify which tasks are performing work when they shouldn't be. For example, if the:app:processDevUniversalDebugManifestis not marked asUP-TO-DATE, it may suggest that your build configuration is dynamically updating the manifest with every build. However, some tasks need to run during each build, such as:app:checkDevDebugManifest.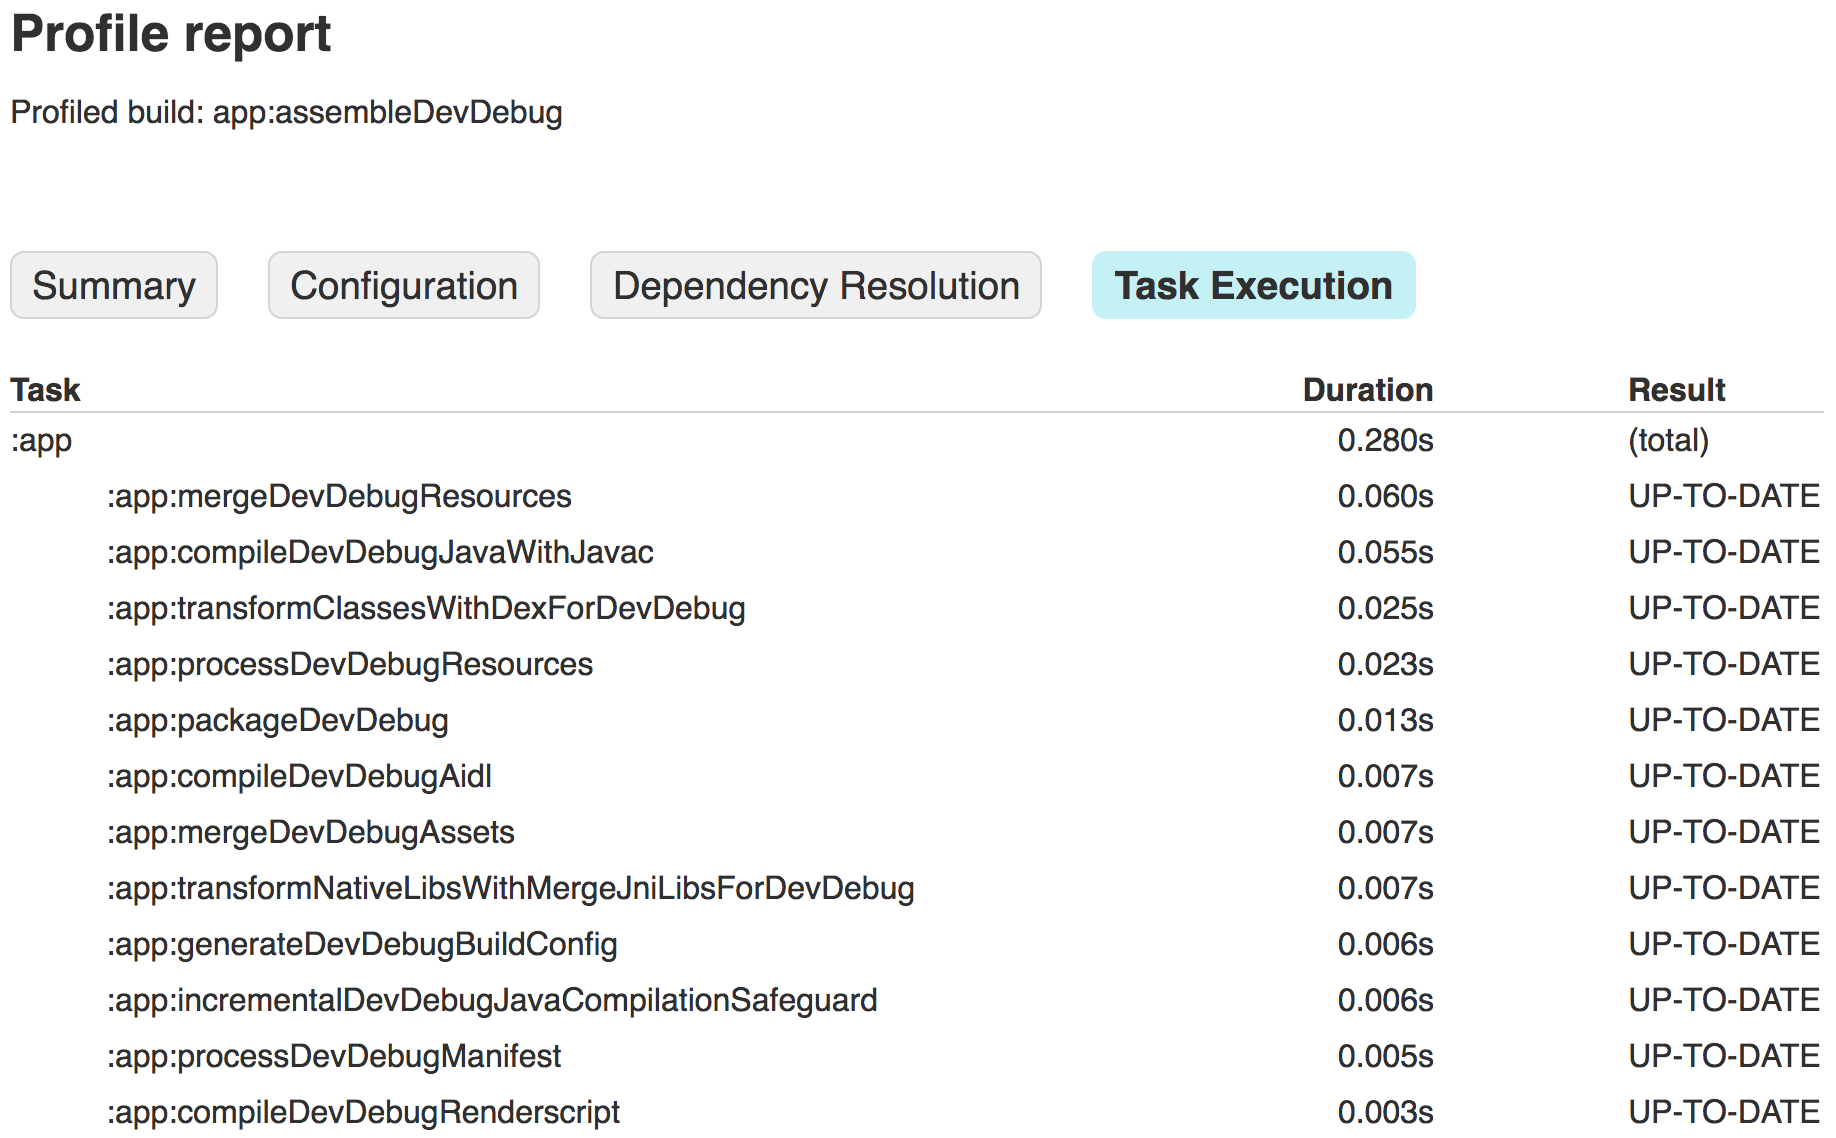
Figure 3. Viewing task execution results.
Now that you have a build profile report, you can begin looking for
optimization opportunities by inspecting the information in each tab of the
report. Some build settings require experimentation because the benefits may
differ between projects and workstations. For example, projects with a large
codebase may benefit from code shrinking
to remove unused code and shrink the app size. However, smaller
projects may benefit more from disabling code shrinking altogether. Additionally,
increasing the Gradle heap size (using
org.gradle.jvmargs) might negatively impact performance on low-memory machines.
After making a change to your build configuration, observe the results of your changes by repeating the steps above and generating a new build profile. For example, figure 4 shows a report for the same sample app after applying some of the basic optimizations described in this page.
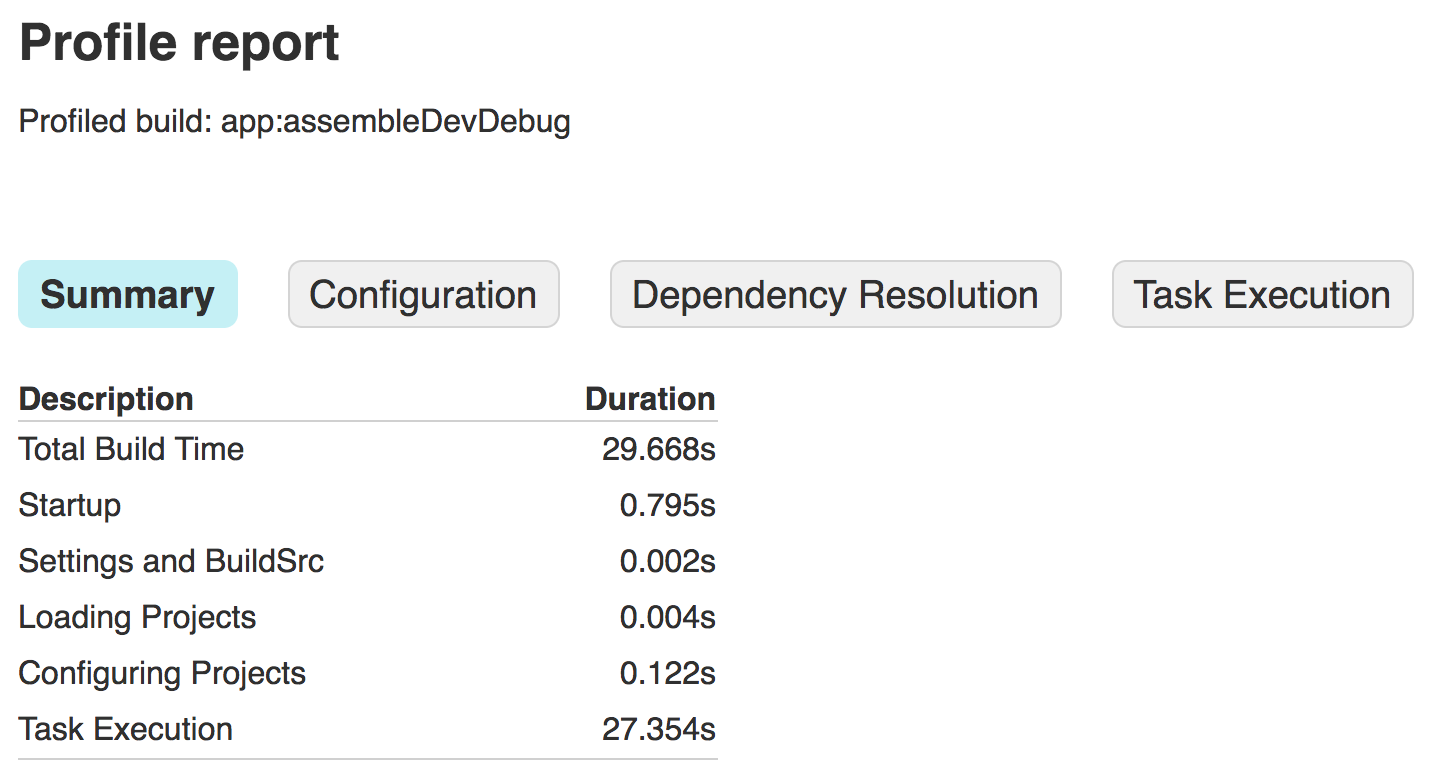
Figure 4. Viewing a new report after optimizing the build speed.