
The Android Framework provides access to raw GNSS measurements on several Android devices.
You can find the tools in the GPS Measurement Tools repo on GitHub, which includes the source code of a preliminary version of GnssLogger and executables for the desktop GNSS Analysis app for Linux, Windows, and macOS. Installation and User Manual.
Google Smartphone Decimeter Challenge
Google, the Institute of Navigation's Satellite Division, and Kaggle are sponsoring the 3rd Smartphone Decimeter Challenge at ION GNSS+. The competition begins Sep 12, 2023, and ends May 23, 2024. Over 150 new traces containing raw GNSS measurements, sensor data, and precise ground truth will be publicly available. Participation in the competition is open to everyone. Participants are encouraged to submit an abstract to the session titled "Smartphone Decimeter Challenge" which will take place at ION GNSS+ 2024.
For more information, including rules and regulations, visit the competition page on Kaggle, which will go live on Sep 12, 2023 at 3:30 pm MDT.
Android devices that support raw GNSS measurements
Raw GNSS measurements support is mandatory on devices that run Android 10 (API level 29) or higher. On Android 9 (API level 28) and lower, raw GNSS measurements support is mandatory in all Android devices that contain hardware year 2016 or newer. Currently, more than 90% of existing Android phones have raw measurements.
The support for some of the raw GNSS measurement fields is optional and can vary based on GNSS chipset used. Examples of these fields include the following:
- Pseudorange and pseudorange rate.
- Navigation message.
- Automatic Gain Controller (AGC) value.
- Accumulated delta range (ADR) or carrier phase.
- Multi-frequency support
Most flagship phones from Pixel, Motorola, Samsung, Xiaomi, OnePlus, and other major phone manufacturers already support L1 and L5 frequencies. Pixel flagship phones as well as other flagship phones from major phone manufacturers that don't use Qualcomm Snapdragon chipsets provide ADR (carrier-phase) as part of the raw measurements.
A database of community-contributed GNSS capabilities of different Android devices is referenced in the article "Crowdsourcing GNSS features of Android devices".
For more information about the definitions of raw measurements fields provided by Android devices, see Global Navigation Satellite Systems.
Original equipment manufacturers (OEMs), developers, and researchers can make use of the tools in this page to test new phone designs, validate functionality, develop new algorithms, evaluate improvements to the GNSS system implementation as well as building value added apps.
SUPL Client Sample Code
Suplclient is sample code that accesses supl.google.com to obtain real time ephemeris. The SuplTester class provides an example on how to use the SUPL Client Project. The SuplTester sets up the SUPL TCP connection specifications, then at a given latitude and longitude sends an LPP SUPL request and prints the SUPL server response.
Antenna calibration information
Starting in Android 11 (API level 30), you can use the
GnssAntennaInfo class to access
antenna characteristics, such as: phase center offset (PCO) coordinates, phase
center variation (PCV) corrections, and signal gain corrections. These
corrections can be applied to the raw measurements to improve accuracy.
When using GnssAntennaInfo, keep the following system behaviors in mind. They
are designed to enhance user privacy.
- The characteristics supplied by this API are only specific to the device model, not an individual device.
Logging raw measurements
You can use Android Studio to build an app that captures raw GNSS measurements and other location data and logs them to a file. For example source code of such an app, see GPS Measurement Tools.
Google GNSSLogger is a sample app that is developed with this functionality. To get GNSS output with the sample app, your device must support raw GNSS measurements.
Once you have captured the GNSS log using the GNSS Logger, you can copy the log files from the device to your computer for further analysis. From within the GNSS Logger you can send the files to yourself via email or save them to Google Drive. Alternatively, you can save the files using the file management app on the device, or you can use the Android Debug Bridge (ADB) as explained in Copy files to/from a device.
Analyzing raw measurements
The GNSS Analysis app reads the GPS/GNSS raw measurements collected by the GNSS Logger and uses them to analyze the GNSS receiver behavior, as shown in figure 1.
You can download the app for Linux, Windows, and macOS systems.
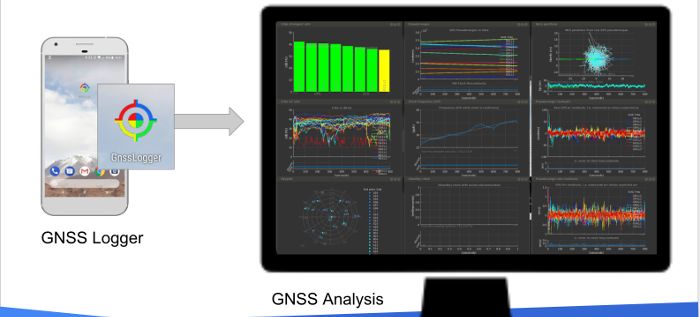
Figure 1. GNSS Logger collects the measurements that can be consumed by GNSS Analysis.
The GNSS Analysis app is built on MATLAB, but you don't need to have MATLAB to run it. The app is compiled into an executable that installs a copy of the MATLAB Runtime.
GNSS Analysis Control Panel
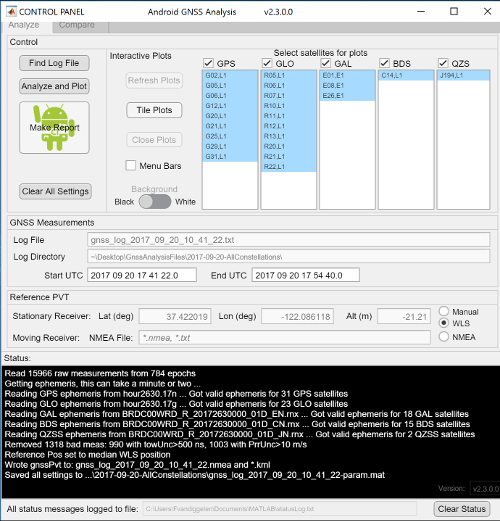
The GNSS Analysis control panel, shown in figure 2, lets you manage app features, such as:
- Select which satellites are displayed.
- Control the reference position, velocity, and time (PVT) used for calculating measurement errors.
- Generate analysis reports.
- Define a window in the data between start and end times.
 )
)
Figure 2. GNSS Analysis control panel
GNSS Analysis interactive plots
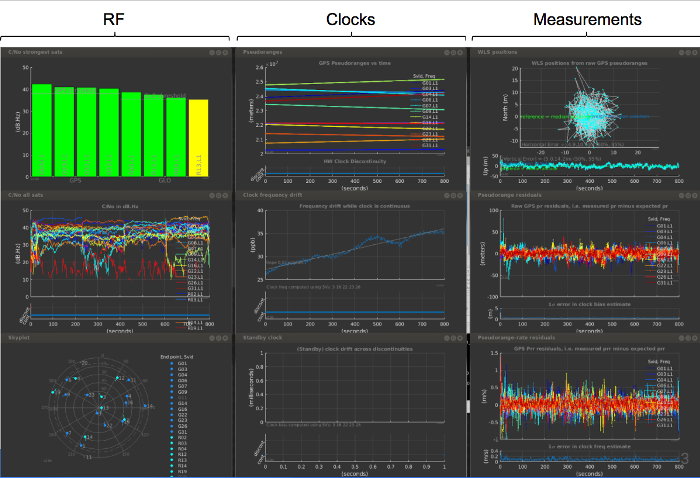
The GNSS Analysis app provides interactive plots organized in radio frequency (RF), clocks, and measurements columns, as shown in figure 3.
 )
)
Figure 3. GNSS Analysis app displaying interactive plots.
The RF column shows the following data:
- For each constellation, the four satellites with the strongest signals.
- For each satellite, the time plot of carrier to noise density (C/No).
- The skyplot of satellite positions.
The clock column shows the following data:
- The pseudoranges.
The offset frequency of the receiver clock, which is computed using one of the following reference positions:
- Automatically computed mean position.
- Latitude, longitude, and altitude entered by the user.
- National Marine Electronics Association (NMEA) file with truth reference PVT.
The offset of the standby clock that keeps time when the receiver resets the duty cycle of the primary oscillator.
The measurements column shows the following data:
- The weighted least squares position results obtained from the raw pseudoranges. The weighting is done using the reported uncertainty of each measurement, which is part of the raw measurement API spec.
- The errors of each pseudorange for each measurement.
The errors of each pseudorange rate for each measurement.
GNSS Analysis test report
GNSS Analysis can generate a test report, as shown in figure 4, that evaluates the API implementation, received signal, clock behavior, and measurement accuracy. For each case, the app reports whether the receiver passed or failed the test based on the performance measured against known benchmarks. The test report is useful for device manufacturers, who can use it as they iterate through the design and implementation of new devices. To generate the test report, click Make Report.
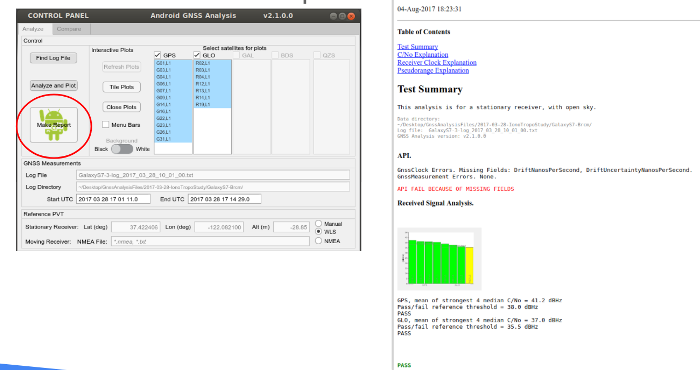
Figure 4. GNSS Analysis test report
The Compare tab provides a side-by-side comparison, shown in figure 5, of C/No from several GNSS log files, which is useful when comparing the RF performance of several devices.
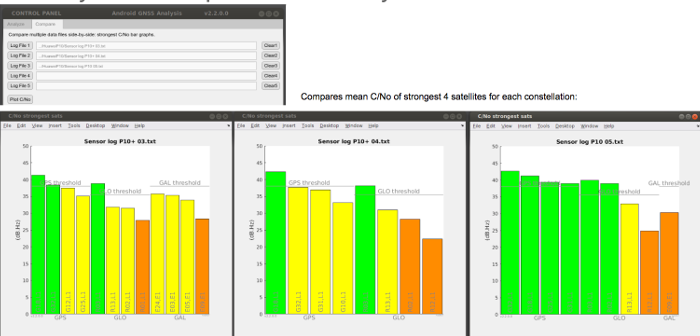
Figure 5. Side-by-side comparison of C/No data from several log files
Interested in the source code? The GPS Measurement Tool Project provides an open source MATLAB example that you can use to perform the following actions using GPS constellation signals:
- Read data captured with the GNSS Logger sample app.
- Compute and visualize pseudoranges.
- Compute weighted least squares position and velocity.
- View and analyze carrier phase.
GNSS Analysis app v4.6.0.1 release notes
GNSS Analysis app version 4.6.0.1 includes the following updates:
- Built GnssAnalysisTool on Matlab R2022a, giving access to new features:
- Status window auto scrolls: latest status message is always visible.
- Added a table of C/N0 comparisons, by constellation, and comparing L1 to L5.
- Added pseudorange rate residual plot.
- Removed separate tabs for Reference PVT Stationary or Moving, making it easier to see which type of Reference PVT has been selected.
- Moved “Make Report” results from HTML to Status Window.
- Removed Mission Planner tab. Please use gnssmissionplanning.com/ or www.gnssplanning.com/.
- Fixes related to RINEX Observation file parsing.
- Fallback to NASA CDDIS ephemeris source for GPS and GLO, when BKG is not working.
- Move from igs.bkg.bund.de to igs-ftp.bkg.bund.de
- Do not exit analysis if GAL, QZSS or BDS ephemeris download fail.
- Create Antenna CNo analysis even if chipset does not support BaseBandCNo
Provide feedback
We want to improve the support for GNSS on Android. Let us know about any issues with GNSS support on Android by using the GNSS issue tracker. Please check if your issue has already been addressed in the FAQ before posting it.
If you have used the GNSS Analysis tools, please provide feedback by answering a short survey. If you have other questions or a request for support, see Developer Support Resources.
You can find answers to frequently asked questions in the GNSS Analysis Tools FAQs.