dmtracedump
コレクションでコンテンツを整理
必要に応じて、コンテンツの保存と分類を行います。
dmtracedump
は、トレースログ ファイルからコールスタックの図を生成するツールです。このツールは Graphviz DOT ユーティリティを使用して図を出力を作成するため、dmtracedump
を実行する前に Graphviz をインストールする必要があります。トレースログをまだ生成しておらず、接続したデバイスからローカルマシンに保存していない場合は、アプリをインストルメント化してトレースログを生成するをご覧ください。
dmtracedump
ツールは、コールスタック データをツリー図として生成します。ツリー図の各ノードはメソッド呼び出しを表します。また、矢印を使用して、親ノードから子ノードへの呼び出しフローを示します。dmtracedump
のサンプル出力を下の図に示します。
dmtracedump
ツールは、Android SDK Tools パッケージで提供され、android-sdk/platform-tools/
にあります。
構文
dmtracedump の使用方法は次のとおりです。
dmtracedump [-ho] [-s sortable] [-d trace-base-name] [-g outfile] trace-base-name
この場合、ツールは trace-base-name.data
と trace-base-name.key
からトレースログ データを読み込みます。
グローバル オプション
グローバル オプション |
説明 |
-h |
HTML 出力をオンにします。 |
-o |
プロファイリングの代わりにトレース ファイルをダンプします。 |
コマンドおよびコマンド オプション
コマンドおよびオプション |
説明 |
-d trace-base-name |
指定トレース名のデータとの差分を返します。 |
-g outfile |
outfile に出力を生成します。 |
-s sortable |
ソート可能な JavaScript ファイルの場所の URL ベースを指定します。 |
-t percent |
グラフに子ノードを含めるかどうかを決定する最小しきい値(親の包括的時間に占める子の包括的時間の割合)。このオプションを使用しない場合、デフォルトしきい値の 20% が使用されます。 |
出力
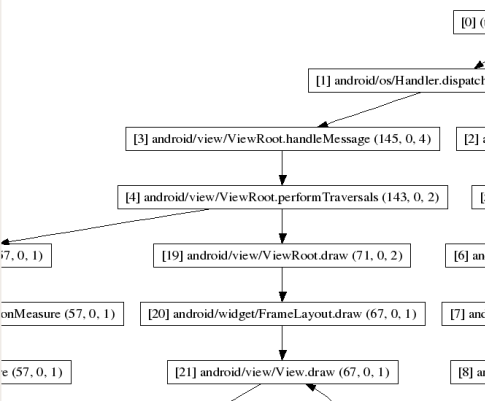
図 1. dmtracedump のスクリーンショット
dmtracedump
は、グラフ内のノードごとに以下の情報を表示します。
ref callname (inc-ms, exc-ms,numcalls)
ref
- トレースログ内で使用される呼び出し参照番号
inc-ms
- 包括的経過時間(すべての子メソッドを含めて、対象メソッドで費やされたミリ秒単位の時間)
exc-ms
- 排他的経過時間(子メソッドを含まずに、対象メソッドで費やされたミリ秒単位の時間)
numcalls
- 呼び出しの数
このページのコンテンツやコードサンプルは、コンテンツ ライセンスに記載のライセンスに従います。Java および OpenJDK は Oracle および関連会社の商標または登録商標です。
最終更新日 2025-07-27 UTC。
[[["わかりやすい","easyToUnderstand","thumb-up"],["問題の解決に役立った","solvedMyProblem","thumb-up"],["その他","otherUp","thumb-up"]],[["必要な情報がない","missingTheInformationINeed","thumb-down"],["複雑すぎる / 手順が多すぎる","tooComplicatedTooManySteps","thumb-down"],["最新ではない","outOfDate","thumb-down"],["翻訳に関する問題","translationIssue","thumb-down"],["サンプル / コードに問題がある","samplesCodeIssue","thumb-down"],["その他","otherDown","thumb-down"]],["最終更新日 2025-07-27 UTC。"],[],[],null,["# dmtracedump\n\n`dmtracedump` is a tool that generates\ngraphical call-stack diagrams from trace log files. The tool uses the Graphviz\nDot utility to create the graphical output, so you need to install Graphviz\nbefore running `dmtracedump`. If you haven't yet generated trace logs and\nsaved them from your connected device to your local machine, go to\n[Generate trace logs by instrumenting your app](/studio/profile/generate-trace-logs).\n\nThe `dmtracedump` tool generates the call stack data as a tree diagram, where each\nnode represents a method call. It shows call flow (from parent node to child nodes)\nusing arrows. The diagram below shows a sample output of `dmtracedump`.\n\nThe `dmtracedump` tool is provided in the Android SDK Tools package and is\nlocated in \u003cvar translate=\"no\"\u003eandroid-sdk\u003c/var\u003e`/platform-tools/`.\n\nSyntax\n------\n\nThe usage for dmtracedump is: \n\n```\ndmtracedump [-ho] [-s sortable] [-d trace-base-name] [-g outfile] trace-base-name\n```\n\nThe tool then loads trace log data from \u003cvar translate=\"no\"\u003etrace-base-name\u003c/var\u003e`.data` and\n\u003cvar translate=\"no\"\u003etrace-base-name\u003c/var\u003e`.key`.\n\n### Global options\n\n| Global options | Description |\n|----------------|------------------------------------------|\n| `-h` | Turn on HTML output |\n| `-o` | Dump the trace file instead of profiling |\n\n### Commands and command options\n\n| Commands and options | Description |\n|------------------------------------------------|---------------------------------------------------------------------------------------------------------------------------------------------------------------------------------------|\n| `-d `\u003cvar translate=\"no\"\u003etrace-base-name\u003c/var\u003e | Diff with this trace name |\n| `-g `\u003cvar translate=\"no\"\u003eoutfile\u003c/var\u003e | Generate output to \u003cvar translate=\"no\"\u003eoutfile\u003c/var\u003e |\n| `-s `\u003cvar translate=\"no\"\u003esortable\u003c/var\u003e | URL base to the location of the sortable javascript file |\n| `-t `\u003cvar translate=\"no\"\u003epercent\u003c/var\u003e | Minimum threshold for including child nodes in the graph (child's inclusive time as a percentage of parent inclusive time). If this option is not used, the default threshold is 20%. |\n\nOutput\n------\n\n\n**Figure 1.** Screenshot of dmtracedump\n\n\u003cbr /\u003e\n\nFor each node in the graph, `dmtracedump` shows the following\ninformation: \n\n```\nref callname (inc-ms, exc-ms,numcalls)\n```\n\n- \u003cvar translate=\"no\"\u003eref\u003c/var\u003e --- Call reference number, as used in trace logs\n- \u003cvar translate=\"no\"\u003einc-ms\u003c/var\u003e --- Inclusive elapsed time (milliseconds spent in method, including all child methods)\n- \u003cvar translate=\"no\"\u003eexc-ms\u003c/var\u003e --- Exclusive elapsed time (milliseconds spent in method, not including any child methods)\n- \u003cvar translate=\"no\"\u003enumcalls\u003c/var\u003e --- Number of calls"]]