
Hierarchy Viewer 已被废弃。如果您使用的是 Android Studio 3.1 或更高版本,则应在运行时改用布局检查器以检查应用的视图层次结构。如需分析应用布局的渲染速度,请使用 Window.OnFrameMetricsAvailableListener,如此博文中所述。
Hierarchy Viewer 是 Android Device Monitor 中内置的一种工具,您可以用它来测量布局层次结构中每个视图的布局速度,从而找出由视图层次结构导致的性能瓶颈。
注意:我们已不再开发 Hierarchy Viewer。要在运行时检查视图层次结构中的属性,您应改用 Android Studio 中的布局检查器。但是,布局检查器目前不提供有关布局性能的详细分析信息。
本页面介绍了 Hierarchy Viewer 以及对布局进行分析的演示。
进行设置
如果您使用的是 Android 模拟器,可以跳过此部分。否则,您需要按照以下步骤设置设备。
注意:您的设备必须搭载 Android 4.1 或更高版本的系统。
- 在您的设备上启用开发者选项。
- 在开发机器上设置环境变量
ANDROID_HVPROTO=ddm。此变量会告知 Hierarchy Viewer 使用
ddm协议连接到设备,该协议与 DDMS 协议相同。需要注意的是,主机上只能有一个进程连接到设备,因此您必须终止任何其他 DDMS 会话才能运行 Hierarchy Viewer。
启动 Hierarchy Viewer
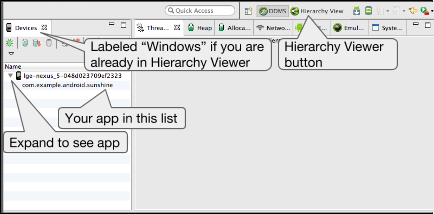
图 1. Android Device Monitor
- 将设备连接到计算机。如果设备上显示对话框提示您允许 USB 调试吗?,请点按确定。
- 在 Android Studio 中打开您的项目,在您的设备上构建并运行项目。
- 启动 Android Device Monitor。Android Studio 可能会显示 Disable adb integration 对话框,因为一次只能有一个进程通过 adb 连接到设备,并且 Android Device Monitor 正在请求连接。因此,请点击 Yes。
图 1 演示了 Android Device Monitor 中最初显示的内容。
- 在菜单栏中,依次选择 Window > Open Perspective,然后点击 Hierarchy View。
您应该会看到类似于图 2 所示的排列方式。如果没有看到,请依次选择 Window > Reset Perspective 以返回默认布局。
- 在左侧的 Windows 标签页中,双击应用的软件包名称。 这样会使用应用的视图层次结构填充相关窗格。
熟悉相关工具
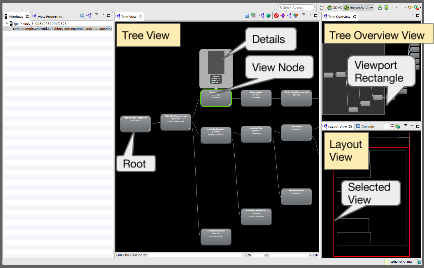
图 2. Hierarchy Viewer 的各个窗格。
Hierarchy Viewer 提供了以下窗格(如图 2 所示):
- Tree View(中央):显示视图层次结构的树状视图。您可以使用鼠标和底部的缩放控件来拖动和缩放树。每个节点都指示它的
View类名和 ID 名称。 - Tree Overview(右上方):可让您一览应用的完整视图层次结构。移动灰色矩形可更改 Tree View 中可见的视口。
- Layout View(右下方):显示布局的线框视图。当前所选视图的轮廓为红色,其父视图为浅红色。
在此处点击某个视图也会在 Tree View 中选择该视图,反之亦然。
视图层次结构是布局的快照,因此它不会自动更新。
如需更新层次结构视图,请点击 Reload the view hierarchy 图标  。
。
如需使某个视图无效(请求在下一次布局更新期间对 onDraw() 进行系统调用),请选择层次结构中的相应视图,然后点击 Invalidate the layout 图标  (这与在视图中调用
 invalidate() 等效)。
要请求实际布局视图(及任何子级),请点击 Request lay out 图标  。
。
如果您转到其他应用,则必须从左侧窗格的 Windows 标签页中选择该应用,以查看其视图层次结构。
要查看有关视图的详细信息,包括其度量、布局和绘制时间(如图 3 所示),请在 Tree View 中点击该视图。双击该视图可查看其放大图片。
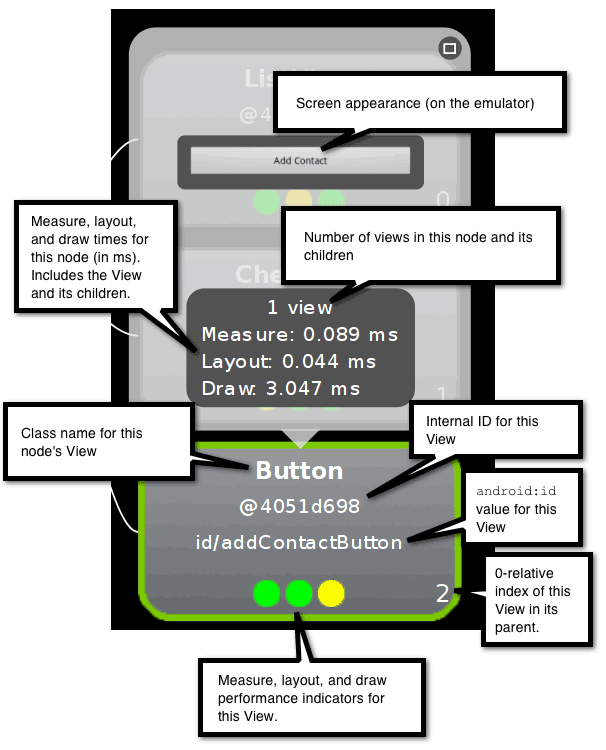
图 3. 视图节点显示界面的各部分。
如需查看视图的属性,请点击左侧窗格中的 View Properties 标签页,如图 4 所示。
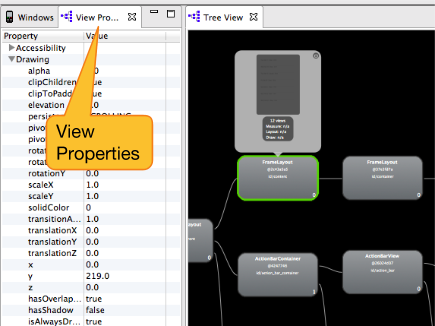
图 4. View Properties 标签页的位置。
如需将布局的分层屏幕截图保存到 Adobe Photoshop (PSD) 文件中,请点击工具栏中的 Capture the window layers 图标  。每个视图都会另存为自己的图层,因此您可以通过隐藏和调整每个视图来轻松创建新的模拟。
分析您的布局
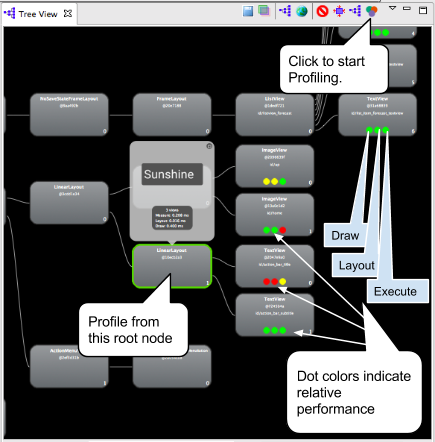
图 5. 分析完成后的视图层次结构。
您已经了解了该工具的用法,现在可以使用它来分析视图层次结构并解读结果了。
- 在 Tree View 或 Layout View 中,点击要分析其子级的视图节点。
- 如需开始分析,请点击 Tree View 顶部的 Obtain layout times 图标
 。
。
对于大型视图层次结构,分析可能需要几秒钟。
所选节点的每个子视图都有三个圆点,可以是绿色、黄色或红色。
- 左边圆点表示渲染管道的绘制过程。
- 中间圆点表示布局阶段。
- 右点圆点表示执行阶段。
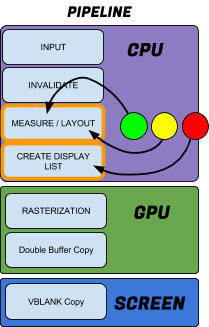
图 6. 各彩色圆点
与渲染管道的关系。
这些圆点大致对应于处理管道的测量、布局和绘制阶段。 圆点的颜色表示该节点相对于本地系列中所有其他已分析节点的相对性能。
- 绿色表示视图的渲染速度至少比一半的其他视图快。
- 黄色表示视图渲染速度比其他视图中渲染速度最慢的那一半快。
- 红色表示视图是渲染速度最慢的那一半视图之一。
解读结果
Hierarchy Viewer 可测量每个节点相对于同级视图的性能,因此分析结果中总是有红色节点(除非所有视图以完全相同的方式执行),并且这并不一定意味着红色节点就是表现不佳(只不过它是本地视图组中最慢的视图而已)。
Hierarchy Viewer 会栅格化您的布局以获取时间信息。栅格化是获取高级基元(如圆形或矢量字体)并将其转换为屏幕上的像素的过程。栅格化通常由设备上的 GPU 完成,但对于软件栅格化,渲染是使用普通软件在 CPU 上完成的。这意味着绝对报告时间相对于彼此是正确的,但会随着设备和开发机器上不断变化的总体 CPU 工作负载而变化。因此,它不能反映设备上的实际性能速度,您应该进行多次分析以了解平均测量结果。
如果应用的运行速度出乎意料地慢,则红色节点可能有问题。在相对设置中,总有一个最慢的节点;只需确保它是您预期的节点即可。以下示例说明了如何解读红色圆点。
- 查找叶节点中的红色圆点或仅包含少数子级的视图组。这可能会找到问题所在。应用的运行速度可能并不缓慢,或者在设备上的运行速度并不慢,但您需要注意这个圆点为何显示为红色。Systrace 或 Traceview 可为您提供更多信息。
- 如果您有一个包含许多子级的视图组和一个红色测量阶段,请查看相应子级以了解它们的执行情况。
- 带有黄色甚或红色圆点的视图在设备上的执行速度可能并不慢。这正是实际数字的用武之地。Systrace 或 Traceview 可为您提供更多信息。
- 如果层次结构的根视图具有红色测量阶段、红色布局阶段和黄色绘制阶段,那这就是一个比较典型的情况,因为它是所有其他视图的父级,并且只有在子级完成之后其布局才会完成。
- 如果具有 20 个以上视图的树中的某个叶节点包含红色绘制阶段,则表示存在问题。请检查
onDraw()方法中是否有不应存在的代码。
如需查看更多布局提示,请参阅改善布局性能。