使用 Traceview 检查轨迹日志
使用集合让一切井井有条
根据您的偏好保存内容并对其进行分类。
Traceview 已废弃。如果您使用的是 Android Studio 3.2 或更高版本,应改为使用 CPU 性能分析器来执行以下操作:检查通过使用 Debug
类对应用进行插桩而捕获的 .trace
文件,记录新方法轨迹,保存 .trace
文件,以及检查应用进程的实时 CPU 使用情况。
Traceview 这款工具能够以图形的形式显示轨迹日志。您可以通过使用 Debug
类在代码中插桩以生成此类日志。这种跟踪方法非常精确,因为您可以指定需在代码中开始和停止记录轨迹数据的确切位置。如果您尚未生成此类轨迹日志并将其从连接的设备保存到本地计算机,请参阅通过应用插桩生成轨迹日志。使用 Traceview 检查此类日志有助于您调试应用并分析其性能。
提示:您可以从命令行使用 dmtracedump
生成轨迹日志文件的图形化调用堆栈图。
如果您不需要查看通过使用 Debug
类对应用进行插桩而记录的轨迹日志,可以使用 Android Studio 3.0 及更高版本中包含的 CPU 性能分析器检查应用的线程并记录方法轨迹。
使用 Traceview 打开轨迹日志
如需通过 Android Studio 中的 Traceview 打开轨迹日志,请按以下步骤操作:
- 启动 Android Device Monitor。
- 在 Android Device Monitor 中,依次选择 File > Open File。
- 找到您要检查的
.trace
文件。
- 点击 Open。
注意:如果您尝试查看在启用了代码缩减功能的情况下构建的应用(如发布 build)的轨迹日志,某些方法和成员名称可能会被混淆处理。您可以使用 ProGuard mapping.txt
文件查明未经混淆的原始名称。如需详细了解此文件,请参阅解码经过混淆的堆栈轨迹。
注意:从命令行运行 traceview
的功能已废弃。
Traceview 概览
打开轨迹日志后,Traceview 会使用以下两个窗格显示日志数据:
- 时间轴窗格,说明每个线程何时进入和退出某个方法
- 分析窗格,总结每个线程在轨迹日志期间的执行情况
以下各部分进一步介绍了 Traceview 的输出窗格。
时间轴窗格
图 1 显示了时间轴窗格的特写。每个线程的执行情况都显示在各自的行中,并且越往右使用的时间越长。每个方法都以不同的颜色显示。第一行下面的细线显示所选方法的子级(从进入到退出)。
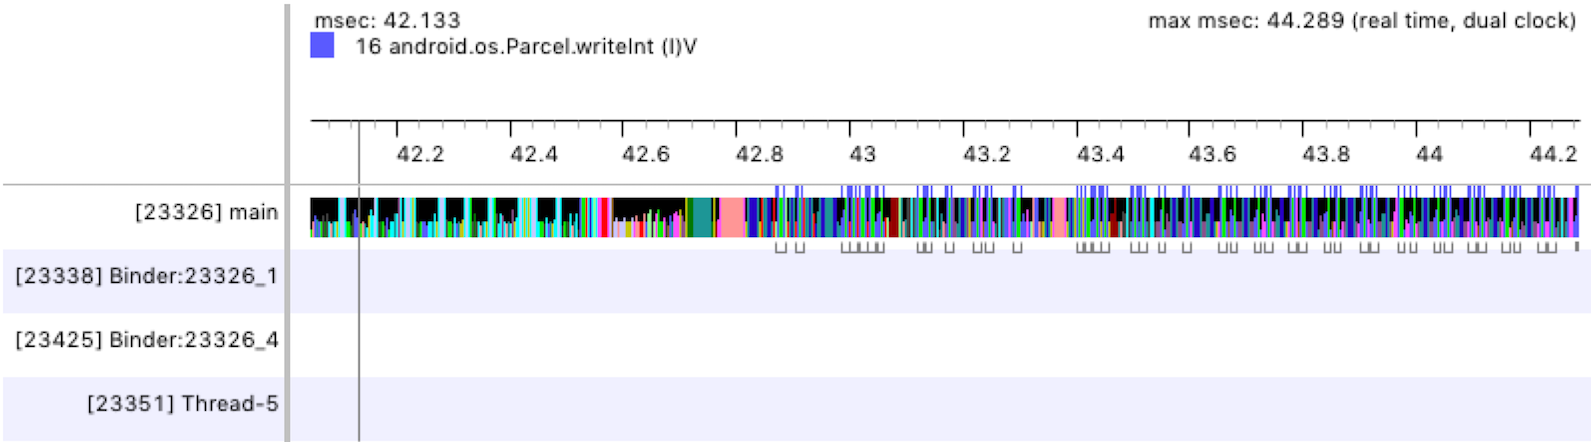
图 1.
Traceview 时间轴窗格。
分析窗格
如图 2 所示,分析窗格列出了系统在轨迹日志期间执行的各个方法以及执行这些方法所用的时间。调用另一个方法的方法称为父级,父级调用的方法称为其子级。当您点击选择某个方法时,它会在两个单独的节点下同时显示其父级和子级。
对于每个方法(顶级节点),该表会显示其非独占时间和独占时间(以毫秒为单位)以及占总时间的百分比。独占时间是执行方法自身代码所用的时间,而非独占时间则是执行方法自身代码所用时间与执行其子级代码所用时间之和。系统还会根据 CPU 时间和实际时间报告用时信息。CPU 时间仅考虑线程主动使用 CPU 的时间,而实际时间则提供从应用进入方法到退出该方法这整个过程(无论线程处于活动状态还是休眠状态)的绝对用时信息。
对于分析窗格中的每个顶级节点,表中的 Calls + Rec, Calls/Total 列(图 2 中未显示)会报告对相应方法的调用次数和递归调用的次数。而对于父方法和子方法,此列会显示当该方法作为顶级节点中方法的子级或父级时的调用次数。
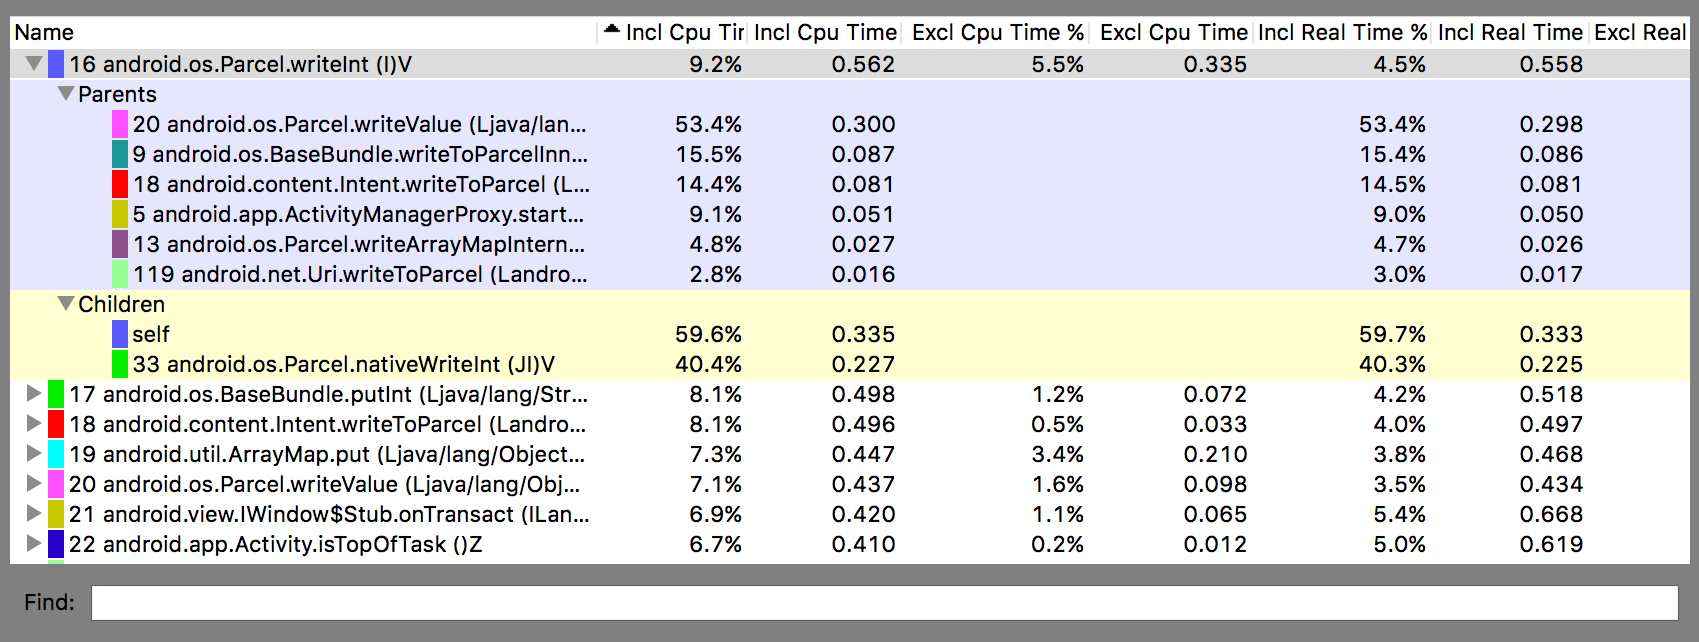
图 2. Traceview 分析窗格。
Traceview 已知问题
TraceView 日志记录无法很好地处理线程,从而导致出现以下问题:
- 如果线程在分析期间退出,不会发出线程名称(在 Android 5.1 及更高版本中已解决此问题);
- 虚拟机会重复使用线程 ID。如果在一个线程停止时另一线程开始,这两个线程可能会获得同一 ID。
本页面上的内容和代码示例受内容许可部分所述许可的限制。Java 和 OpenJDK 是 Oracle 和/或其关联公司的注册商标。
最后更新时间 (UTC):2025-07-27。
[[["易于理解","easyToUnderstand","thumb-up"],["解决了我的问题","solvedMyProblem","thumb-up"],["其他","otherUp","thumb-up"]],[["没有我需要的信息","missingTheInformationINeed","thumb-down"],["太复杂/步骤太多","tooComplicatedTooManySteps","thumb-down"],["内容需要更新","outOfDate","thumb-down"],["翻译问题","translationIssue","thumb-down"],["示例/代码问题","samplesCodeIssue","thumb-down"],["其他","otherDown","thumb-down"]],["最后更新时间 (UTC):2025-07-27。"],[],[],null,["# Inspect trace logs with Traceview\n\n**Traceview is deprecated.** If you're using Android\nStudio 3.2 or later, you should instead use\n[**CPU Profiler**](/studio/profile/cpu-profiler) to inspect\n`.trace` files captured by\n[instrumenting your app](/studio/profile/generate-trace-logs)\nwith the [`Debug`](/reference/android/os/Debug)\nclass, record new method traces, save `.trace` files, and inspect\nreal-time CPU usage of your app's processes.\n\nTraceview is a tool that provides a graphical representations of\ntrace logs. You can generate the logs by instrumenting your code with the\n[`Debug`](/reference/android/os/Debug) class. This method of tracing is\nvery precise because you can specify exactly where in the code you want to start\nand stop logging trace data. If you haven't yet generated these trace logs and\nsaved them from your connected device to your local machine, go to [Generate\ntrace logs by instrumenting your app](/studio/profile/generate-trace-logs).\nInspecting these logs using Traceview helps you debug your app and\nprofile its performance.\n\n\n**Tip:** You can [use\n`dmtracedump`](/studio/command-line/dmtracedump) from the command-line to generate a graphical\ncall-stack diagrams of your trace log files.\n\nIf you don't need to view trace logs that you have recorded by instrumenting\nyour app with the [Debug](/reference/android/os/Debug)\nclass, you can [use the CPU profiler](/studio/profile/cpu-profiler)\nincluded in Android Studio 3.0 and higher to inspect your app's threads and record\nmethod traces.\n\nOpen a trace log using Traceview\n--------------------------------\n\nTo open a trace log with Traceview from Android Studio, proceed as follows:\n\n1. Start [Android Device Monitor](/studio/profile/monitor).\n2. In the Android Device Monitor, select **File \\\u003e Open File**.\n3. Navigate to the `.trace` file you want to inspect.\n4. Click **Open**.\n\n\u003cbr /\u003e\n\n**Note:** If you are trying to view the trace logs\nof an app that is built with code shrinking enabled (such as a release build),\nsome method and member names might be obfuscated. You can use the ProGuard\n`mapping.txt` file to figure out the original unobfuscated names.\nFor more information on this file, see\n[Decode an obfuscated\nstack trace](/studio/build/shrink-code#decode-stack-trace).\n\n**Note:** Running `traceview` from the\ncommand line has been deprecated.\n\nTraceview overview\n------------------\n\nAfter opening a trace log, Traceview displays log data using the following two\npanes:\n\n- A [timeline pane](#timeline_pane) that describes when each thread enters and exits a method\n- A [profile pane](#profile_pane) that summarizes the execution of each thread over the period of the trace log\n\nThe sections below provide addition information about the traceview output panes.\n\n### Timeline pane\n\nFigure 1 shows a close up of the timeline pane. Each thread's execution is\nshown in its own row, with the elapsed time increasing towards the right.\nEach method is shown in varying colors. The thin lines underneath the first\nrow show the children (from entry to exit) of the selected method.\n\n\n**Figure 1.**\nThe Traceview timeline pane.\n\n\u003cbr /\u003e\n\n### Profile pane\n\nAs shown in figure 2, the profile pane provides a list of each method the system\nexecuted over the period of the trace log and the time spent executing those\nmethods. A method that calls another method is referred to as the *parent* , and\nmethods that a parent calls are referred to as its *children*. When you\nselect a method by clicking on it, it displays both its parents and its children\nunder two separate nodes.\n\nFor each method (top-level node), the table shows both its inclusive and\nexclusive times (in milliseconds) as well as the percentage of the total time.\n*Exclusive time* is the time spent executing the method's own code, while\n*inclusive time* is the time spent executing the method's own code plus the time\nspent executing its children. Timing information is also reported in terms of\nCPU time and real time. *CPU time* considers only the time that the thread is\nactively using CPU time, and *real time* provides absolute timing information\nfrom the moment your app enters a method to when it exits that method---regardless\nof whether the thread is active or sleeping.\n\nFor each top-level node in the profile pane, the **Calls + Rec, Calls/Total**\ncolumn in the table (not shown in figure 2) reports the number of calls to the\nmethod and the number of recursive calls. Or, for parent and child methods, this\ncolumn shows the number of calls in which the method was a child or parent of\nthe method in the top-level node.\n\n\n**Figure 2.** The Traceview profile pane.\n\n\u003cbr /\u003e\n\nTraceview known issues\n----------------------\n\nTraceview logging does not handle threads well, resulting in the following\nissues:\n\n- If a thread exits during profiling, the thread name is not emitted (fixed in Android 5.1 and later);\n- The VM reuses thread IDs. If a thread stops and another starts, they may get the same ID."]]