
This page lists the new features introduced in Android Studio preview releases. The preview builds provide early access to the latest features and improvements in Android Studio. You can download these preview versions. If you encounter any problems using a preview version of Android Studio, let us know. Your bug reports help to make Android Studio better.
Canary releases contain leading edge features under active development, and are lightly tested. While you can use Canary builds for development, be aware that features might be added or changed. Release Candidates (RC) are the next version of Android Studio, and are almost ready for stable release. The feature set for the next version has been stabilized. See [Android Studio release names][studio-release-names] to understand Android Studio version naming.
For the latest news on Android Studio preview releases, including a list of notable fixes in each preview release, see the Release Updates in the Android Studio blog.
Current versions of Android Studio
The following table lists the current versions of Android Studio and their respective channels.
| Version | Channel |
|---|---|
| Android Studio Narwhal | 2025.1.1 | Stable |
| Android Gradle plugin 8.11.0 | Stable |
| Android Studio Narwhal Feature Drop | 2025.1.2 | RC |
Compatibility with Android Gradle plugin previews
Each preview version of Android Studio is published alongside a corresponding version of the Android Gradle plugin (AGP). Preview versions of Studio should work with any compatible stable version of AGP. However, if you're using a preview version of AGP, you must use the corresponding preview version of Studio (for example, Android Studio Chipmunk Canary 7 with AGP 7.2.0-alpha07). Attempts to use divergent versions (for example, Android Studio Chipmunk Beta 1 with AGP 7.2.0-alpha07) will cause a Sync failure, which results in a prompt to update to the corresponding version of AGP.
For a detailed log of Android Gradle plugin API deprecations and removals, see the Android Gradle plugin API updates.
Android Studio Narwhal Feature Drop | 2025.1.2
The following are new features in Android Studio Narwhal Feature Drop | 2025.1.2.
To see what's been fixed in this version of Android Studio, see the closed issues.
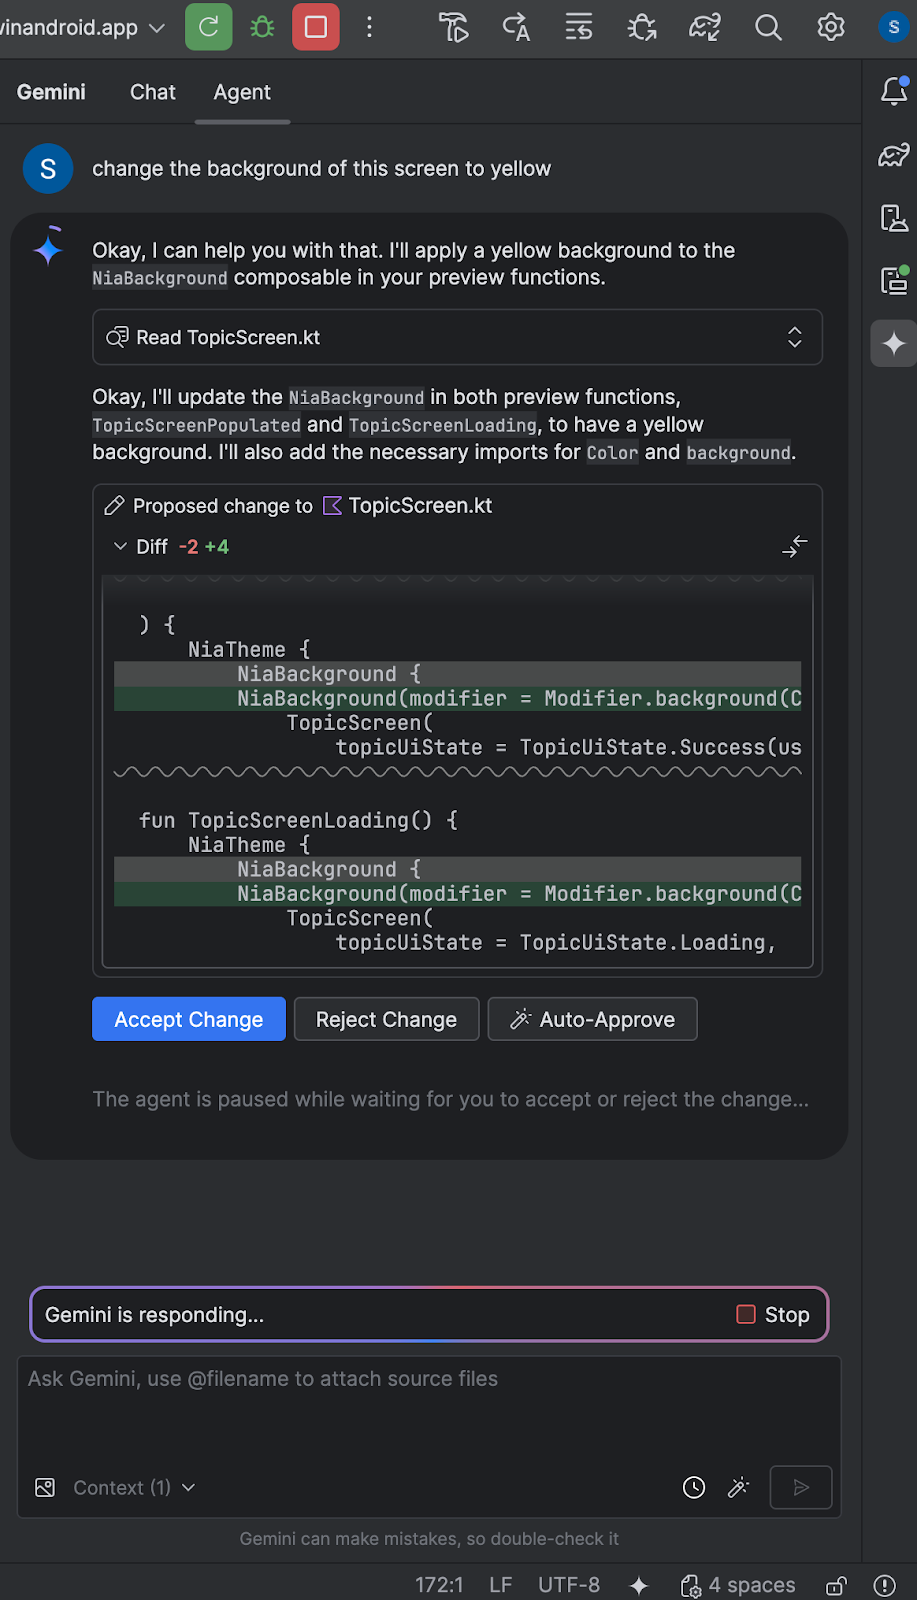
Gemini in Android Studio's Agent mode
Gemini in Android Studio's Agent mode is a new AI feature designed to handle complex, multi-stage development tasks that go beyond what you can experience by chatting with Gemini. To use Agent mode, click Gemini in the sidebar and then select the Agent tab. You can describe a complex goal, like generating unit tests or fixing errors, and the agent formulates an execution plan that spans multiple files in your project. The agent suggests edits and iteratively fixes bugs to reach the goal. You can review, accept, or reject the proposed changes and ask the agent to iterate on your feedback.
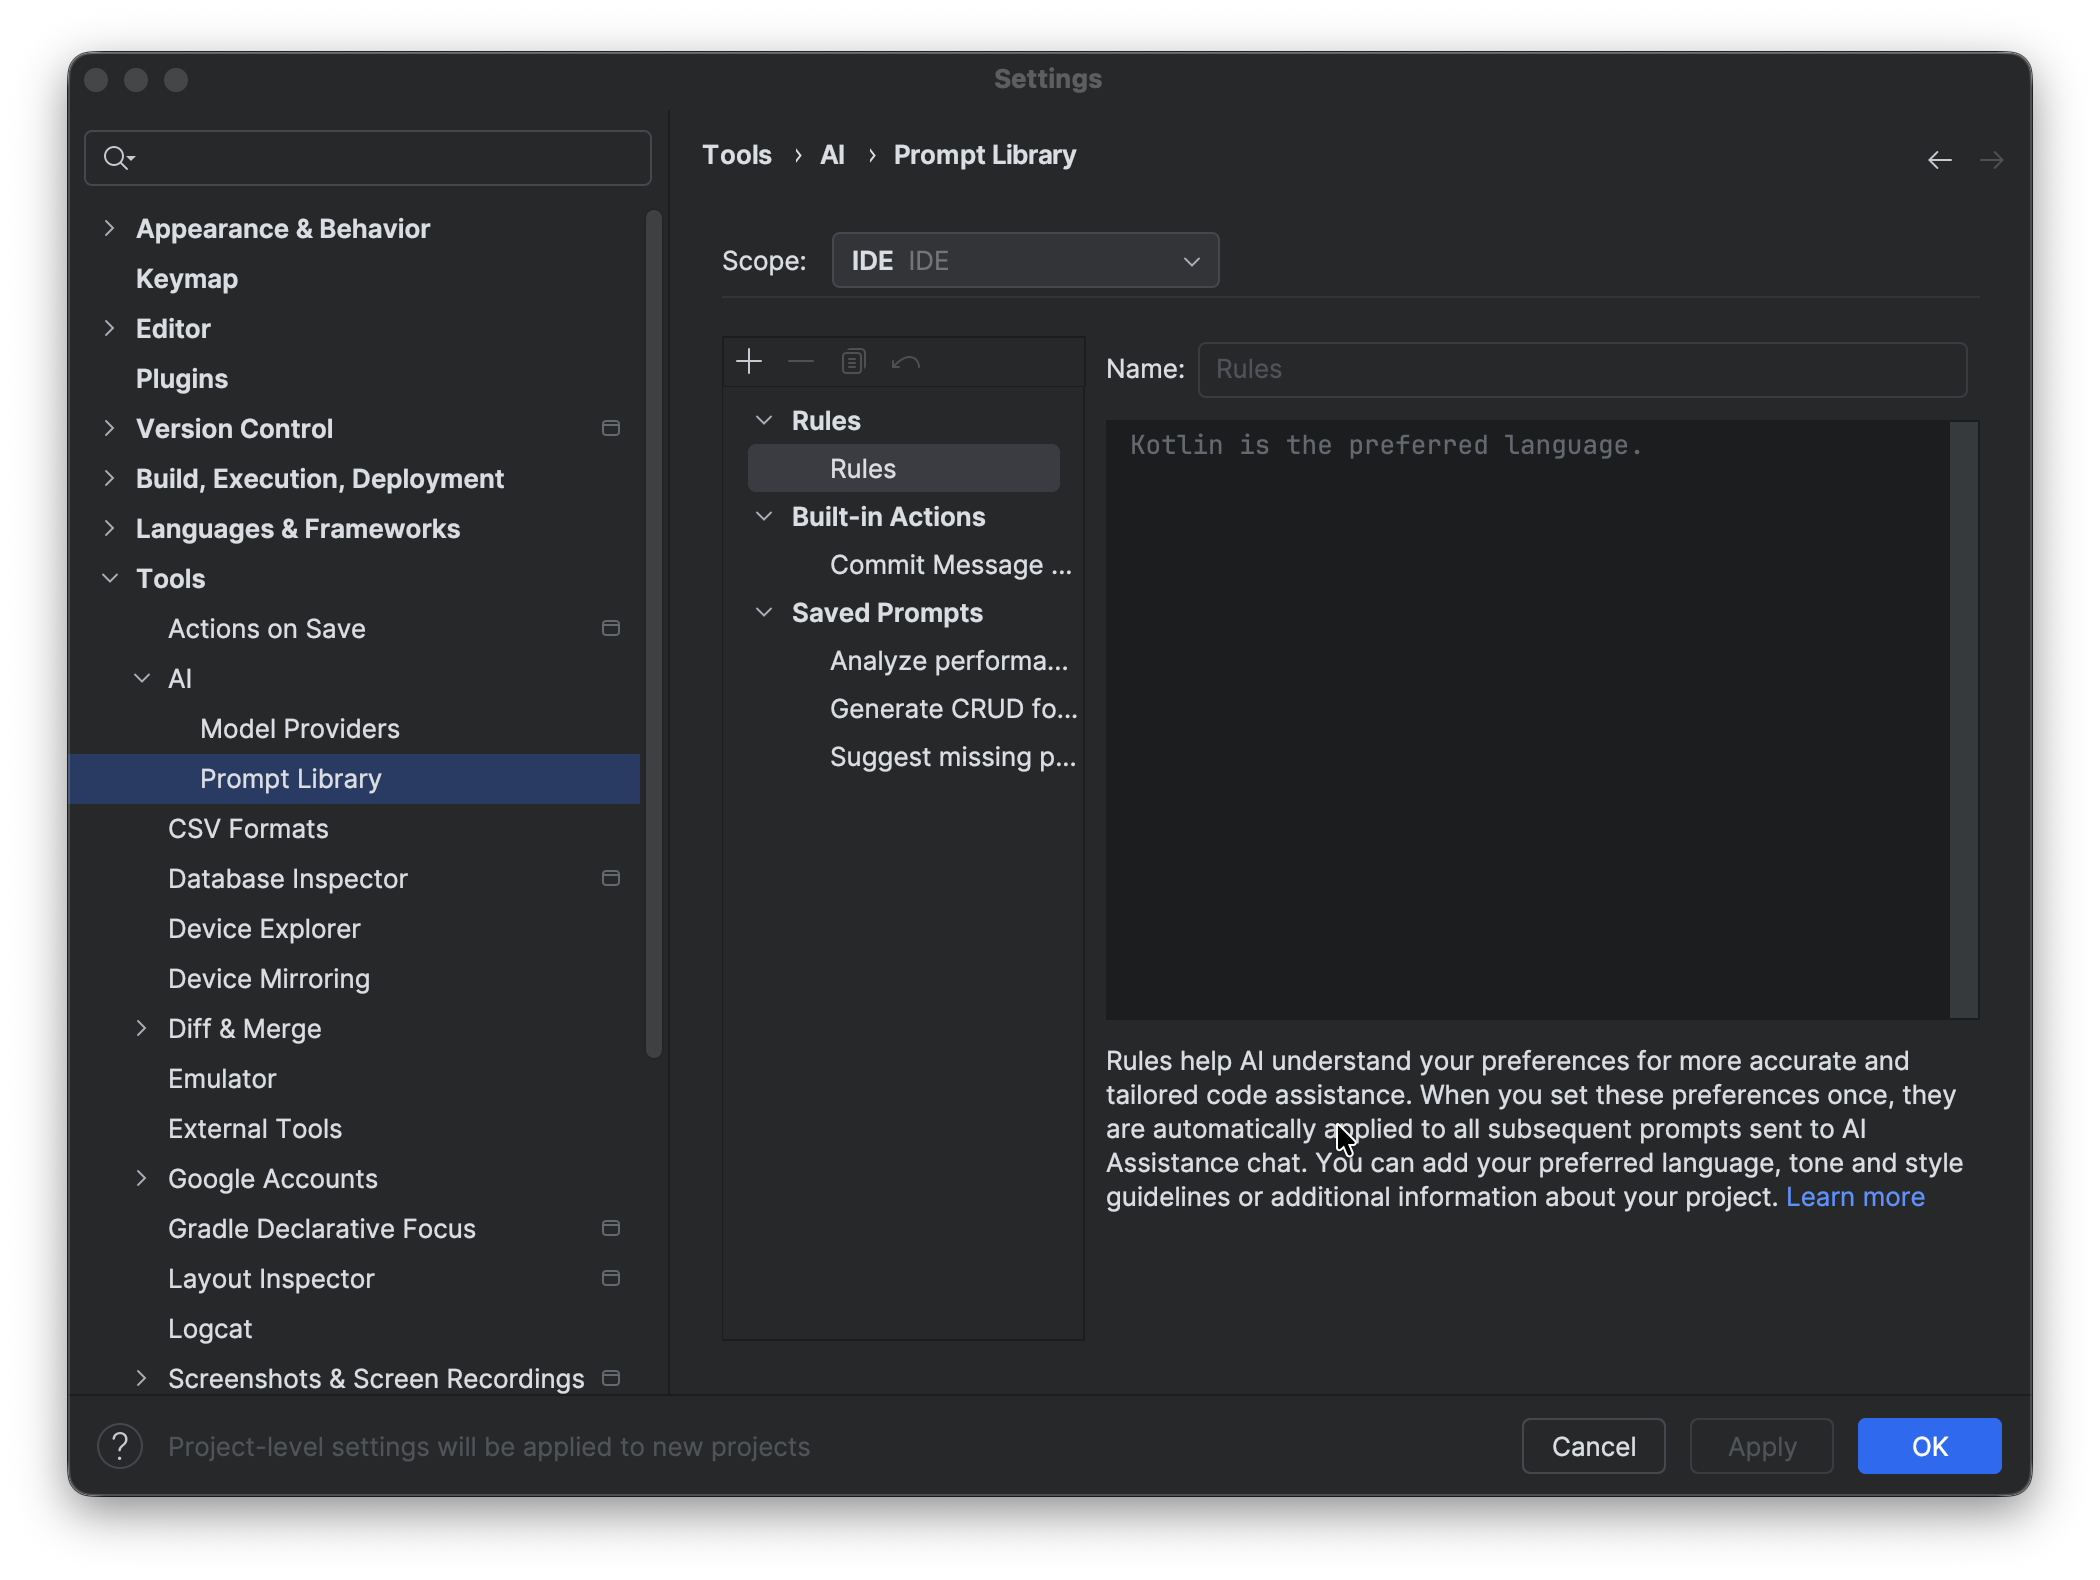
Rules in Gemini
Rules in Gemini let you define preferred coding styles or output formats within the Prompt Library. You can also mention your preferred tech stack and languages. When you set these preferences once, they are automatically applied to all subsequent prompts sent to Gemini. Rules help the AI understand project standards and preferences for more accurate and tailored code assistance. For example, you can create a rule such as "Always give me concise responses in Kotlin."
To set up a rule, go to Android Studio > Settings > Tools > Gemini > Prompt Library > Rules and edit the text in the editor. Use the drop-down to store rules at the IDE level or the project level:
- IDE-level rules are private to yourself and can be used across multiple projects.
- Project-level rules can be shared among teammates working on the same project.
To share prompts across the team you must add the
.ideafolder to the version control system.
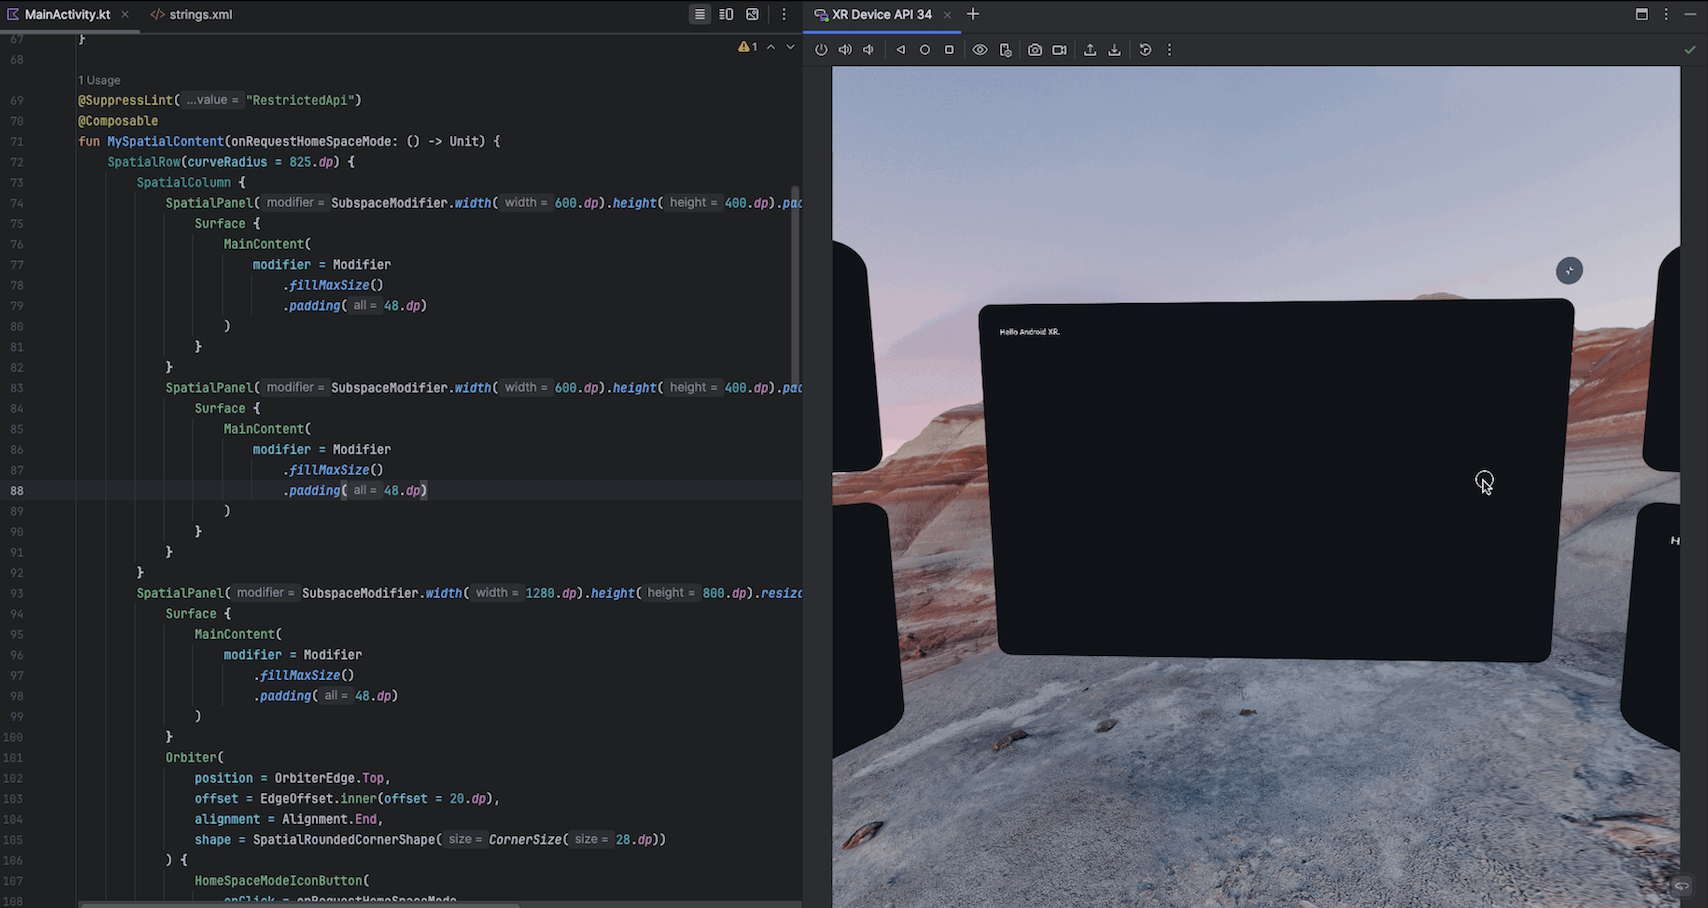
Embedded XR Emulator
The XR Emulator now launches by default in the embedded state. You can now deploy your application, navigate the 3D space and use the Layout Inspector directly inside Android Studio.
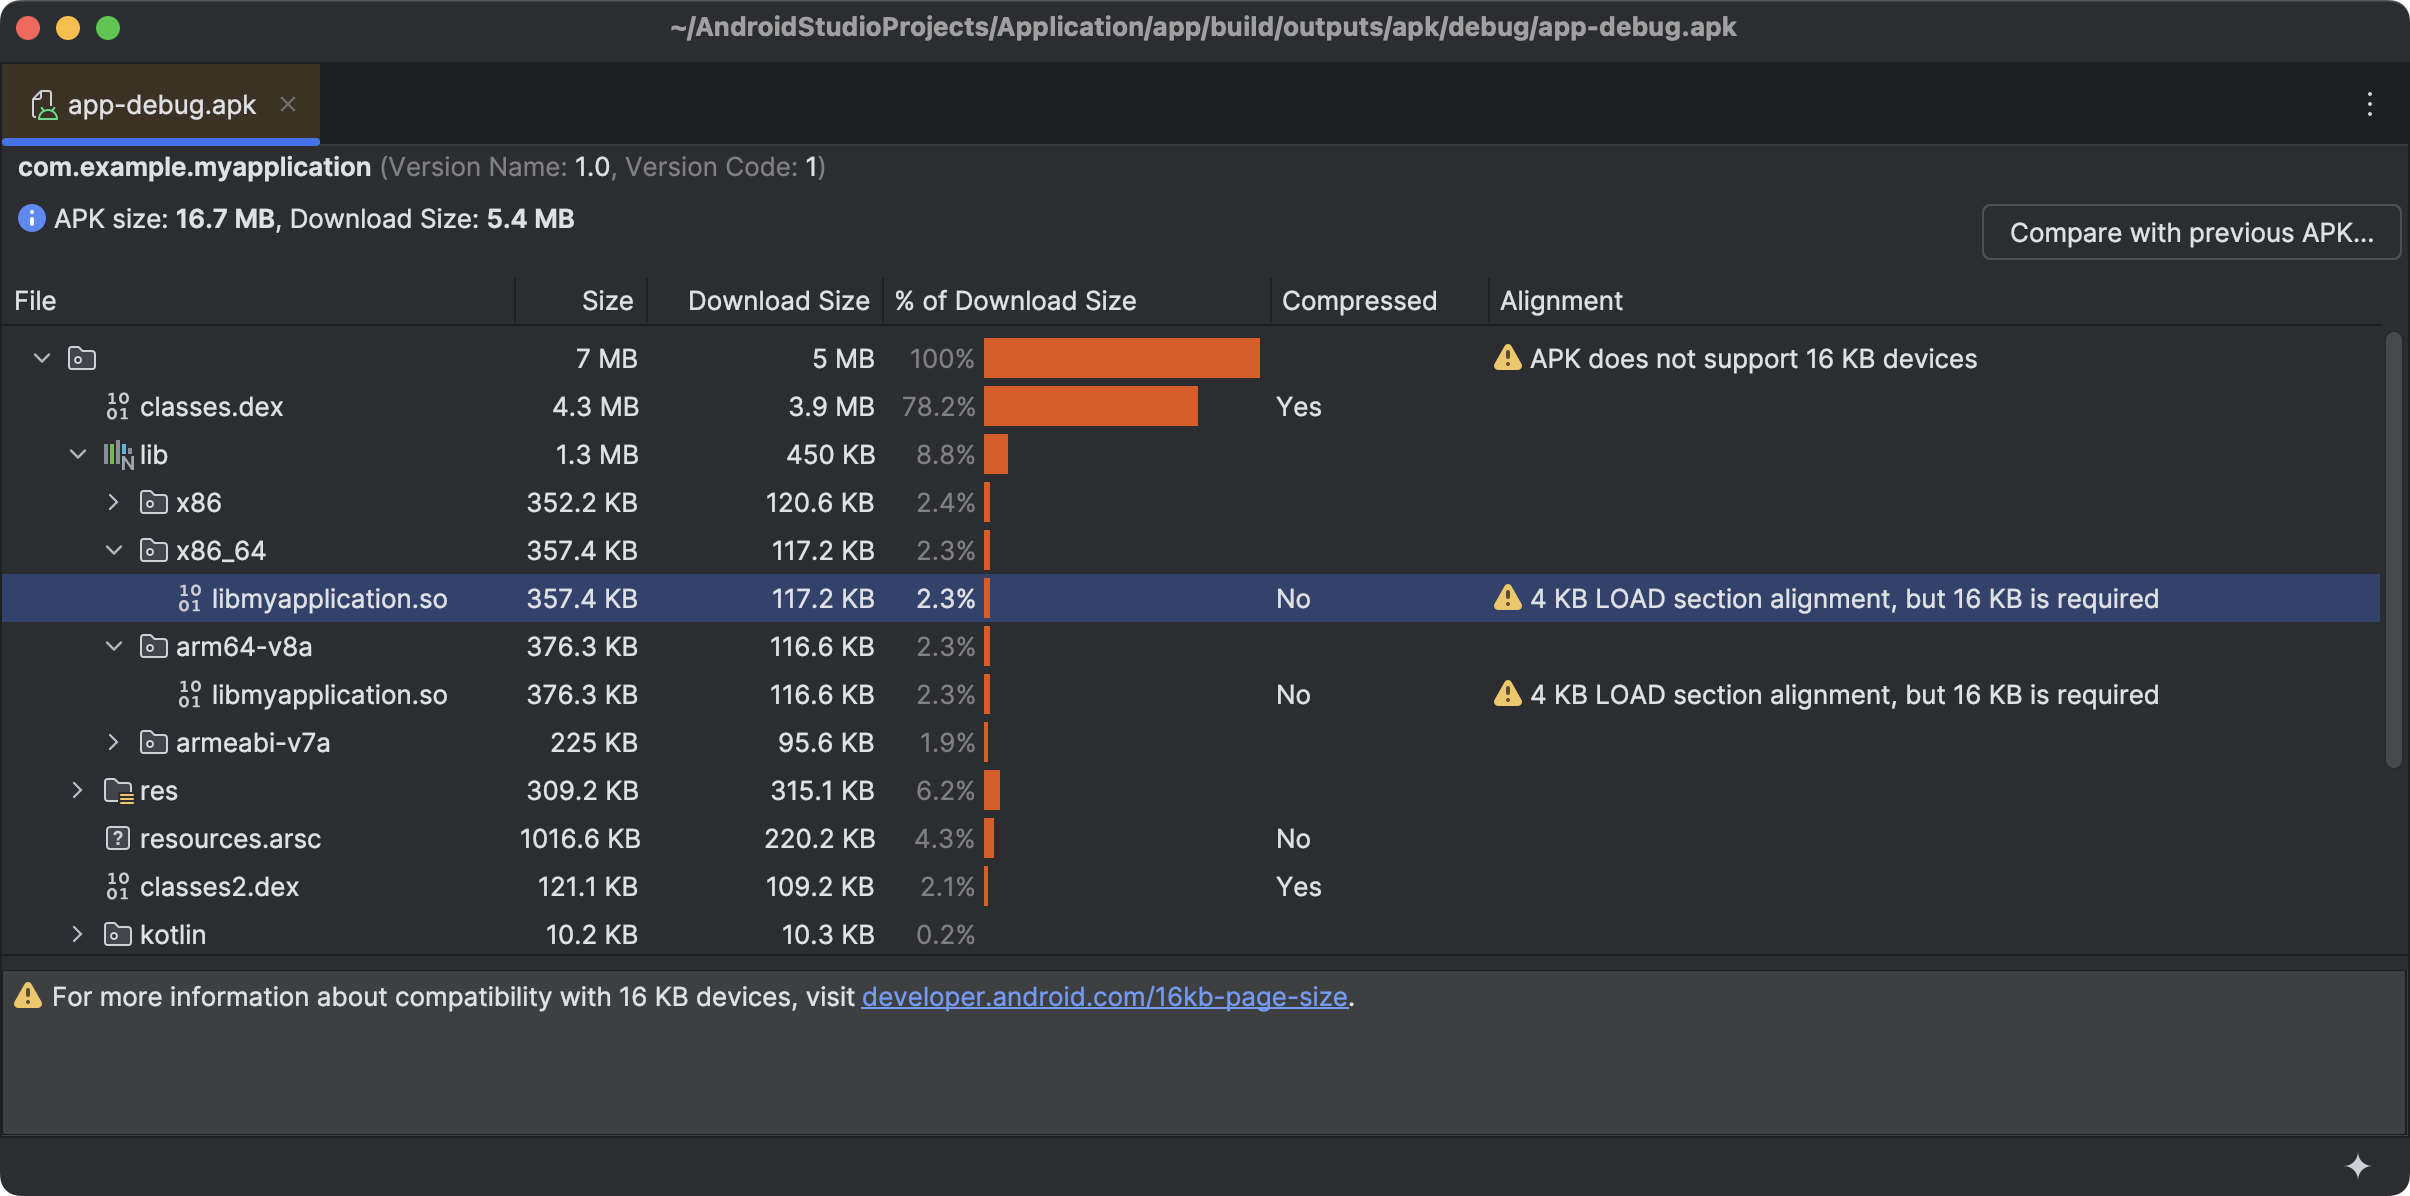
16 KB page size support
Android Studio Narwhal Feature Drop adds improved support for transitioning to 16 KB page sizes. To help you navigate this transition smoothly, Android Studio now offers proactive warnings when building APKs or Android App Bundles that are incompatible with 16 KB devices. Using the APK Analyzer, you can also find out which libraries are incompatible with 16 KB devices. To test your apps in this new environment, a dedicated 16 KB emulator target is also available in Android Studio alongside existing 4 KB images.
Android Studio XR support available
Android Studio Narwhal includes support for developers building immersive experiences with Jetpack XR! This release introduces tools to help you experiment, deploy, and debug XR applications with greater efficiency.
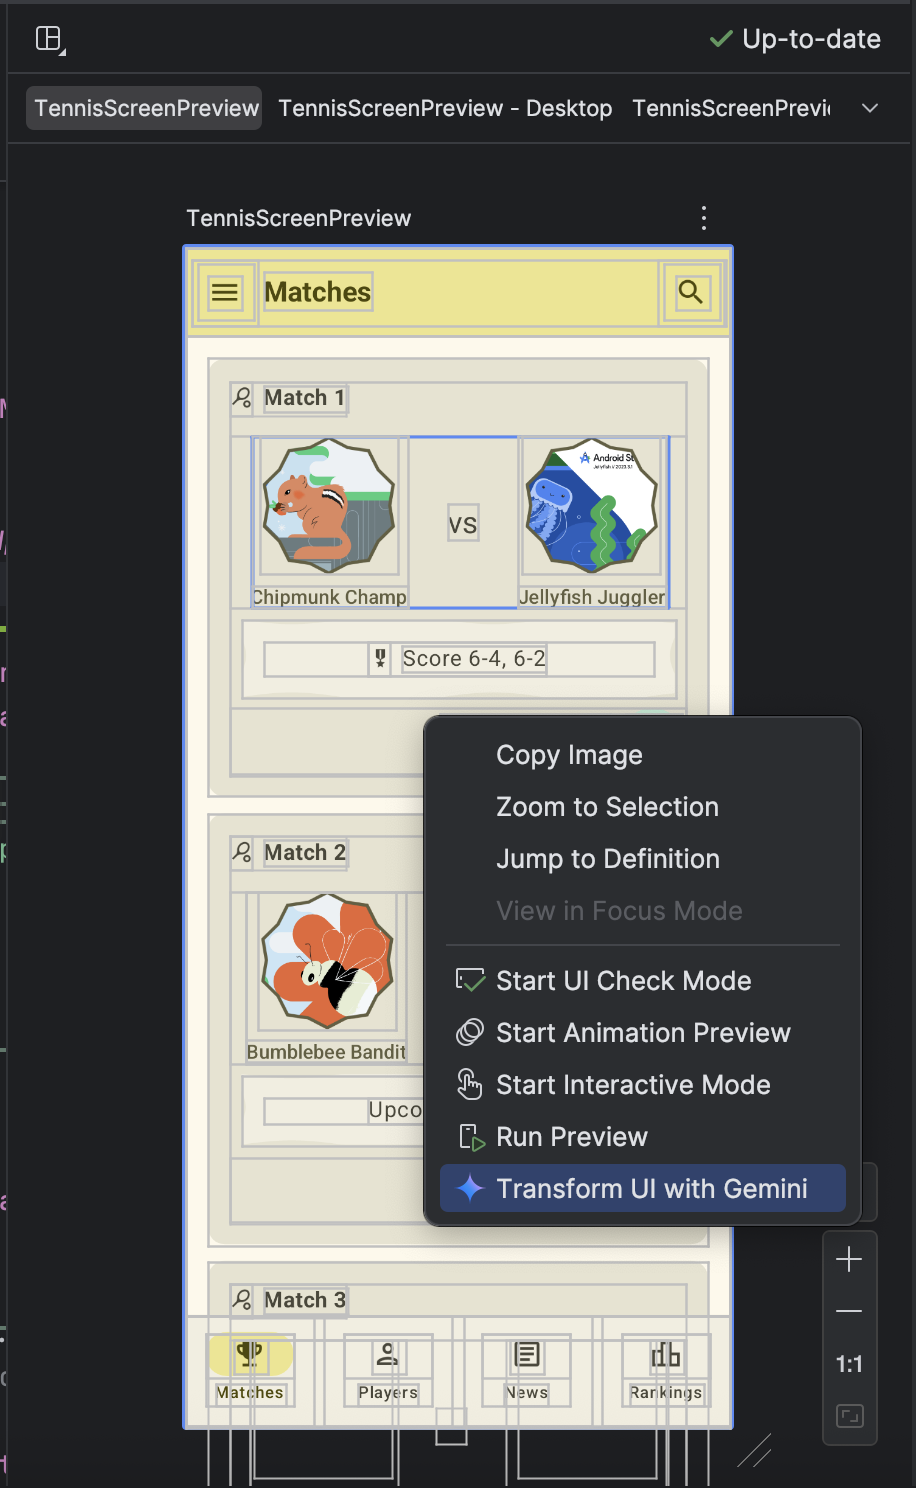
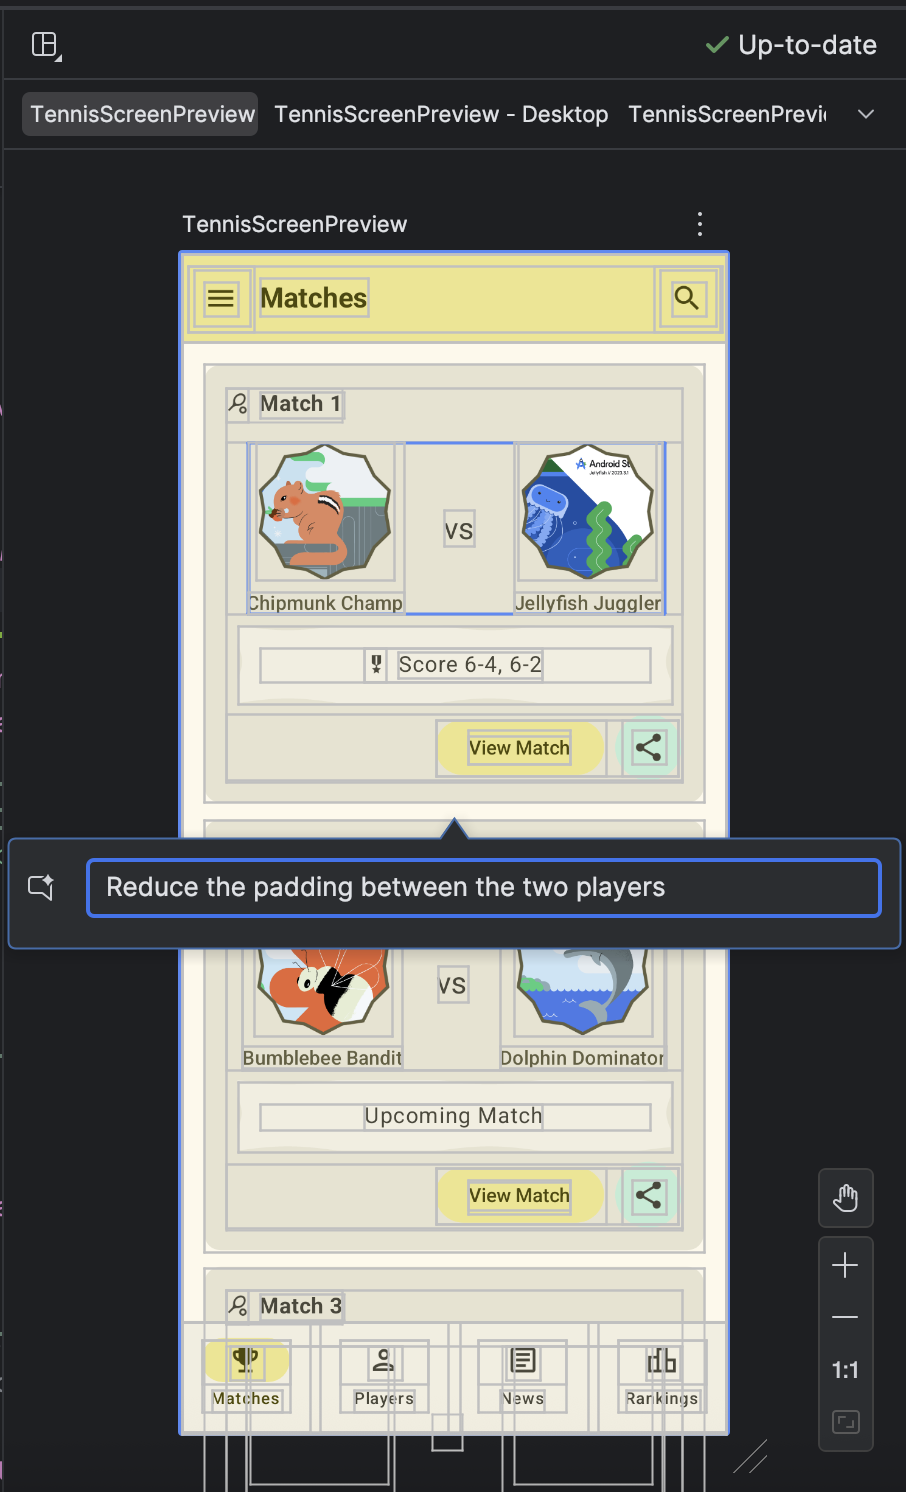
Transform UI with Gemini
You can now transform UI code within the Compose Preview environment using natural language directly in the preview. To use it, right-click in the Compose Preview and select Transform UI With Gemini. Then enter your natural language requests, such as "Center align these buttons," to guide Gemini in adjusting your layout or styling, or select specific UI elements in the preview for better context. Gemini will then edit your Compose UI code in place, which you can review and approve, speeding up the UI development workflow.
|
|
Android Studio Narwhal Feature Drop requires at least AGP 4.0
Projects must use AGP 4.0 or higher to be compatible with Android Studio Narwhal Feature Drop. See the AGP and Android Studio compatibility requirements.