Build 창을 열려면 메뉴 바에서 View > Tool Windows > Build를 선택합니다.
빌드 분석 도구에서 빌드 보고서를 보려면 Build 창에서 Build Analyzer 탭을 클릭합니다.
빌드 분석 도구에서 제공하는 데이터는 빌드에 따라 변경될 수 있으므로 프로젝트를 여러 번 빌드하고 데이터를 비교하여 패턴을 식별하는 것이 좋습니다.
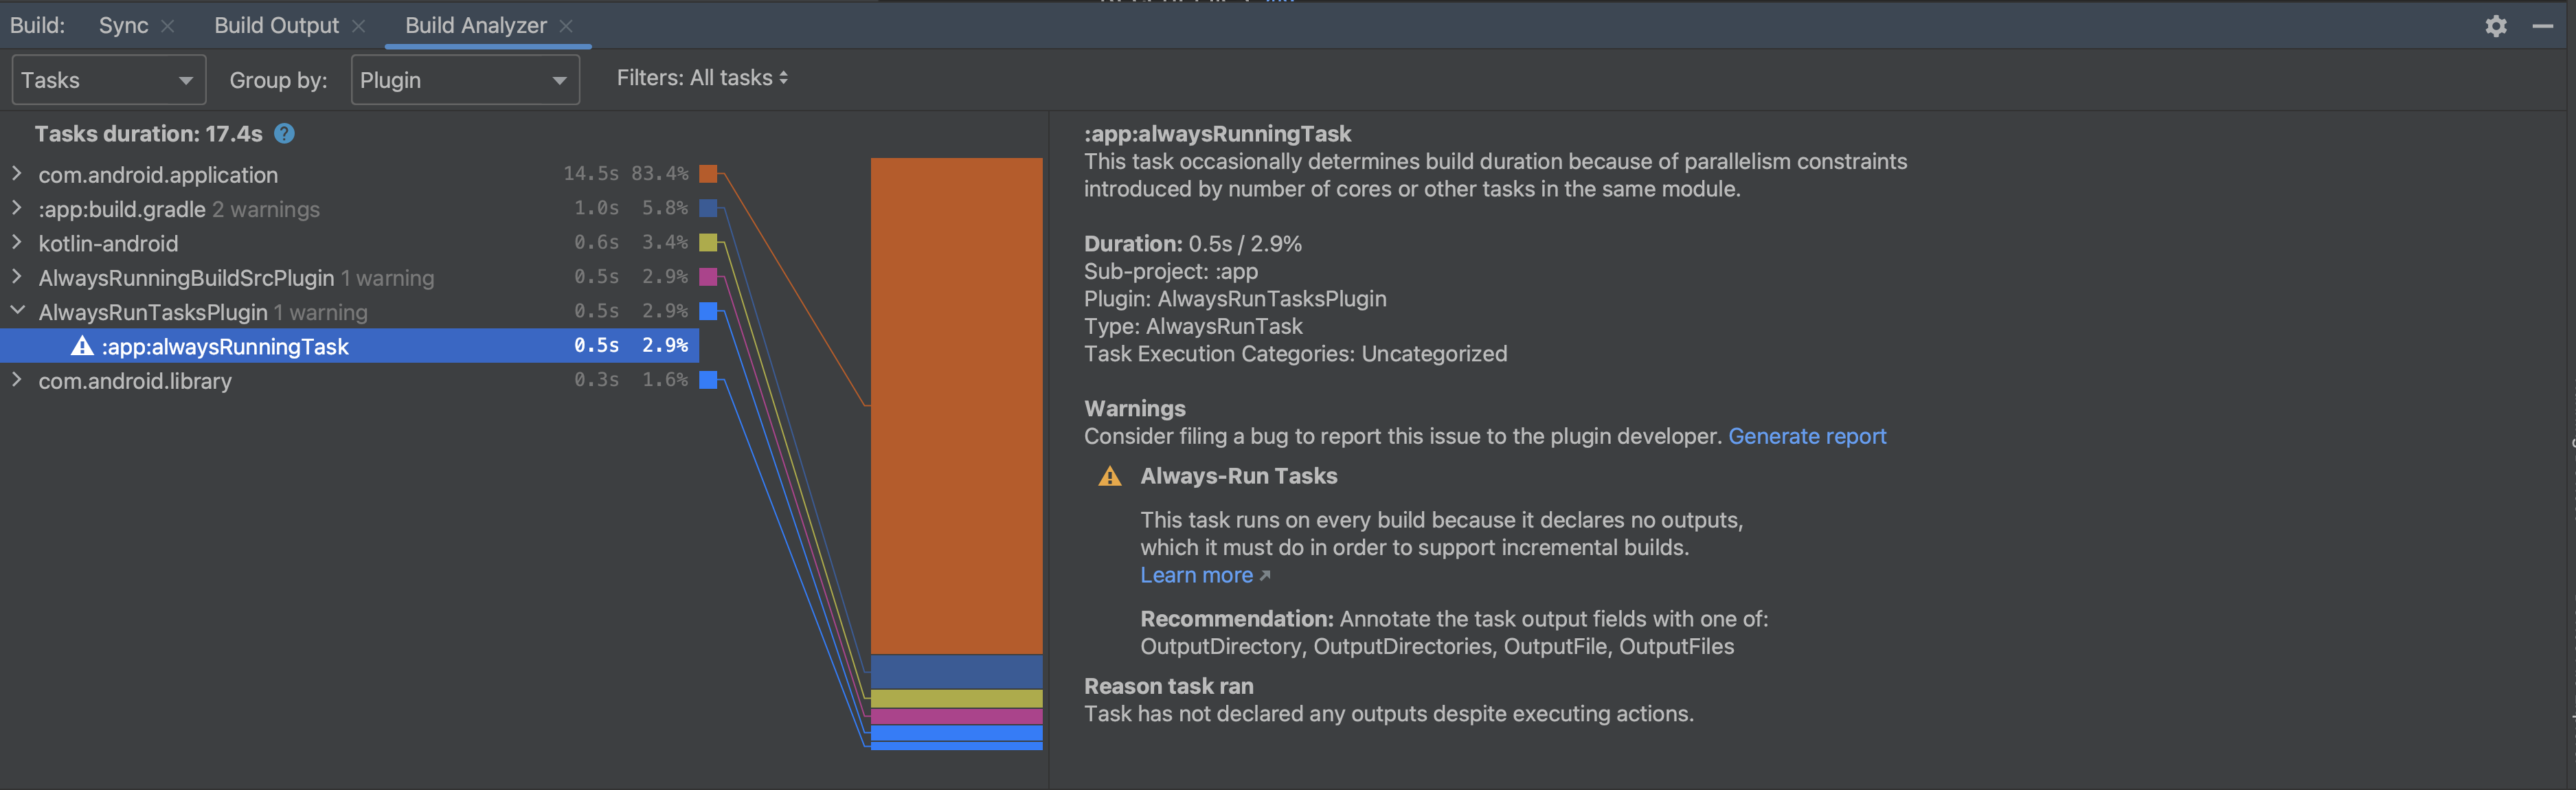
빌드 기간을 결정하는 작업이 포함된 플러그인 보기
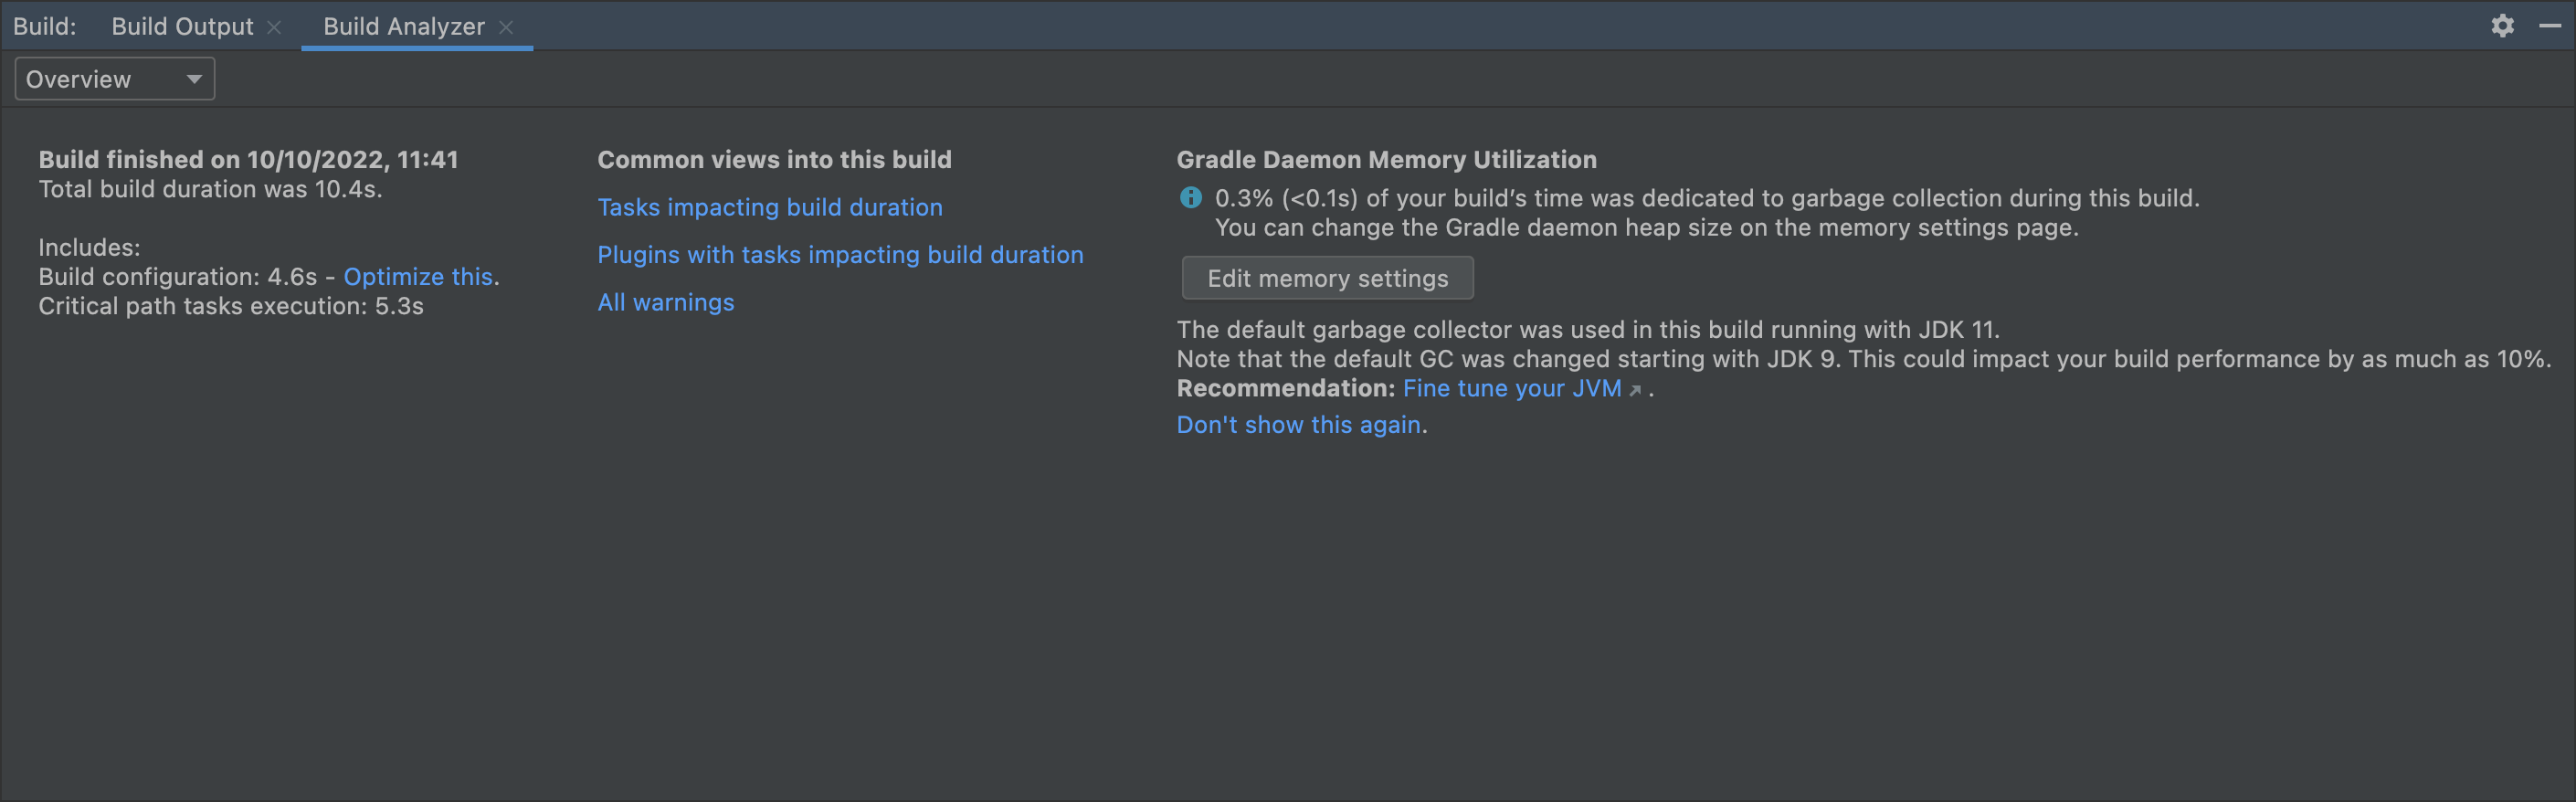
빌드를 완료한 후 빌드 분석 도구를 처음 열면 창에는 그림 1과 같이 빌드 분석 개요가 표시됩니다.
그림 1. 분석 결과를 요약하여 제공하는 빌드 분석 도구 개요 페이지
빌드 기간을 결정하는 작업이 포함된 플러그인 분석을 보려면 개요 페이지에서 Plugins with tasks impacting build duration을 클릭하세요. 드롭다운에서 Tasks를 선택하여 플러그인별로 그룹화하고 있는지 확인할 수도 있습니다. 그래프는 완료하는 데 걸리는 총 시간을 기준으로 플러그인과 관련 작업을 정렬합니다.
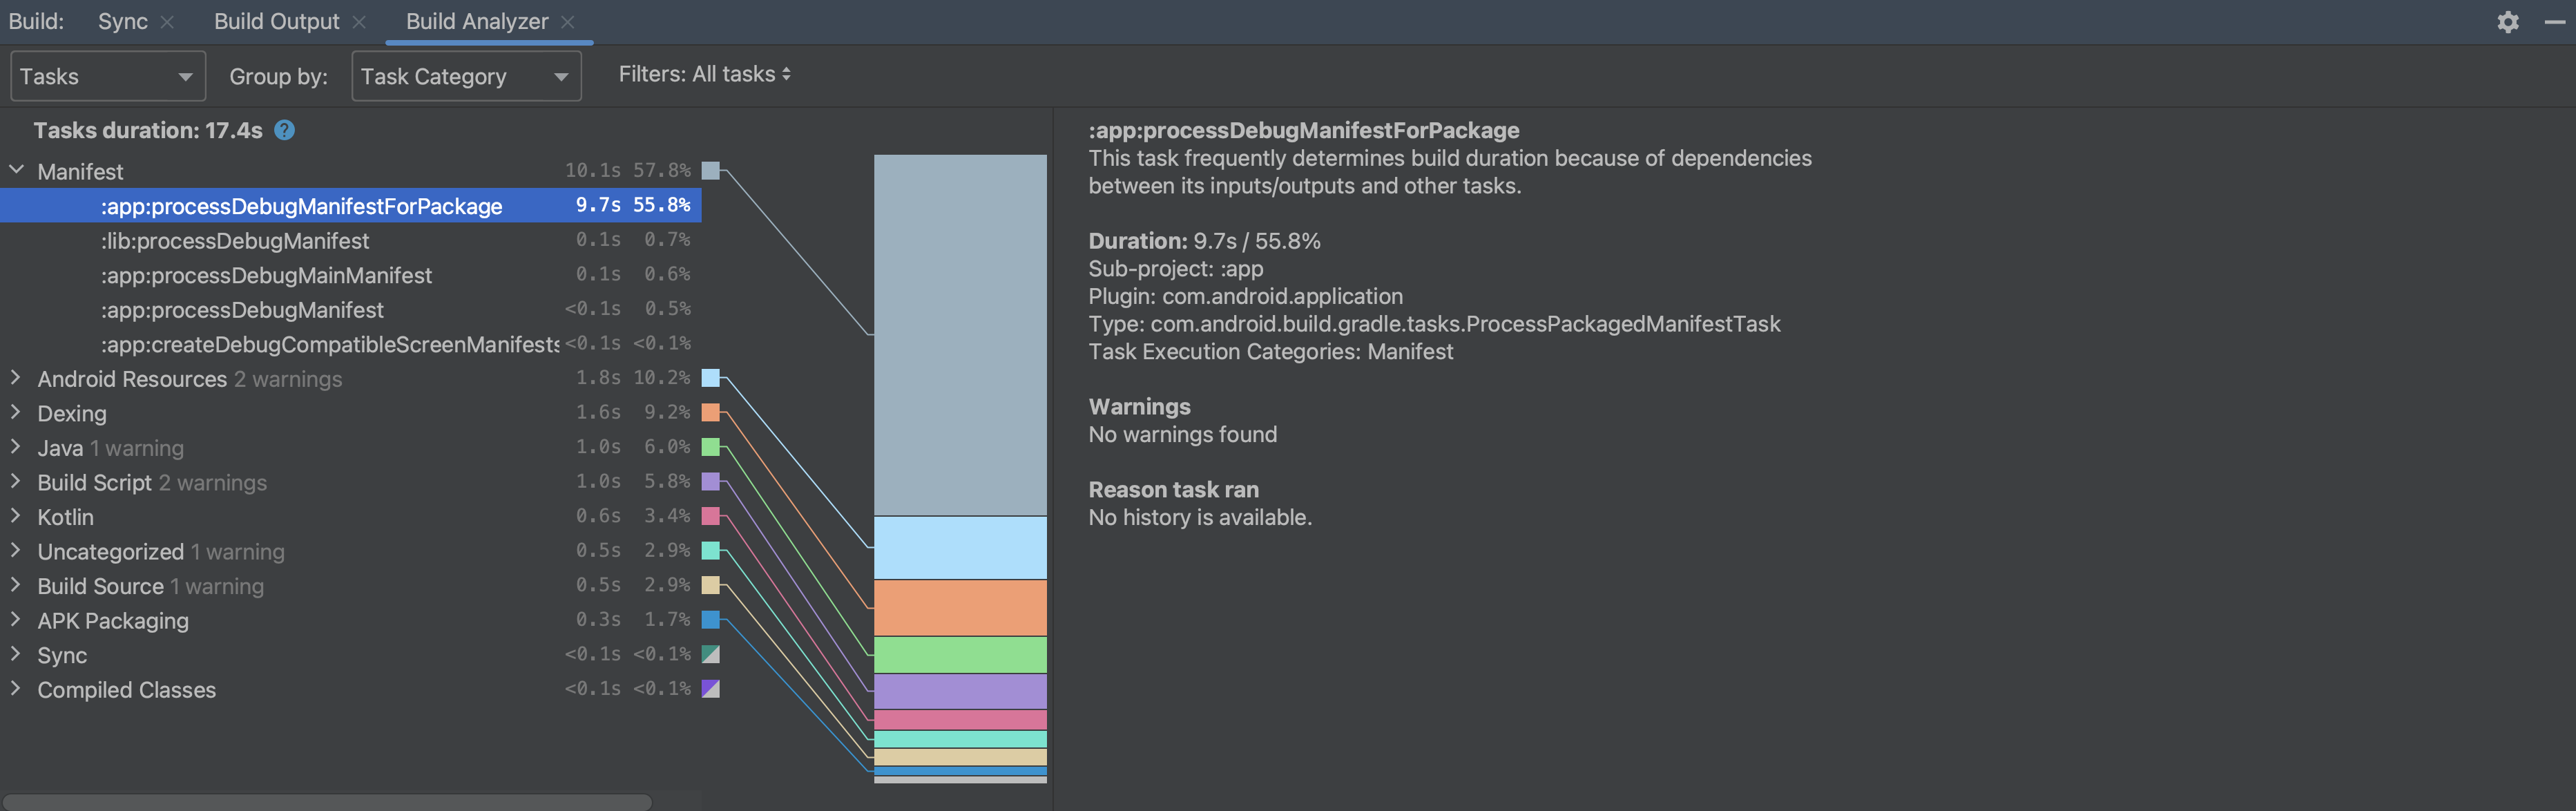
그림 2. 빌드 기간에 영향을 미치는 플러그인의 분석 내용을 제공하는 빌드 분석 도구
빌드 기간을 결정하는 작업 보기
빌드 기간에 기여하는 작업의 분석 내용을 보려면 개요 페이지에서 Tasks impacting build duration을 클릭하거나 드롭다운에서 Tasks를 선택합니다. 프로젝트에서 AGP 8.0 이상을 사용하는 경우 기본적으로 작업이 카테고리별로 그룹화되므로 빌드 기간에 영향을 미치는 영역을 더 쉽게 식별할 수 있습니다. 각 하위 작업을 클릭하여 실행에 관해 자세히 알아보세요.
그림 3. 빌드 기간에 가장 큰 원인이 되는 작업의 분석 내용을 제공하는 빌드 분석 도구
검사 경고
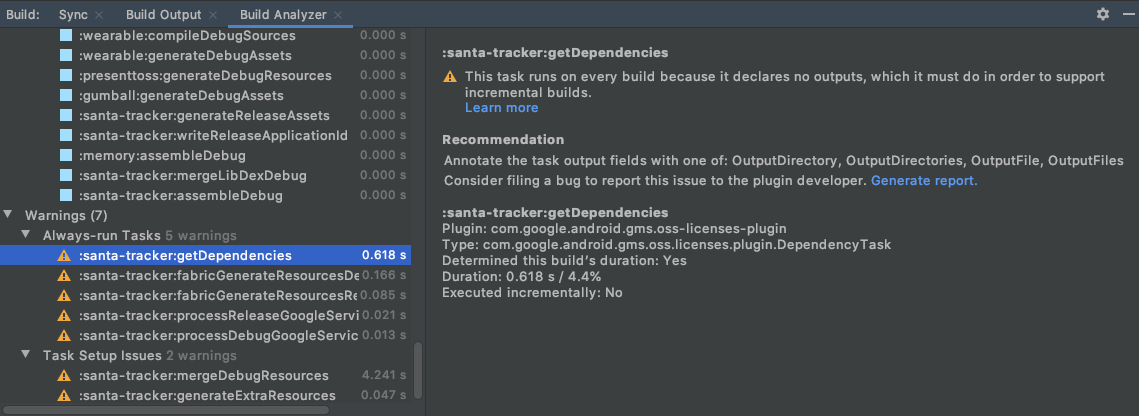
일부 작업을 더 효율적으로 실행하도록 구성할 수 있는 경우, 빌드 분석 도구는 경고를 표시합니다. 빌드 분석 도구에서 빌드에 관해 식별한 모든 경고를 보려면 개요 페이지에서 All warnings를 클릭하거나 드롭다운에서 Warnings를 선택합니다.
일부 경고에는 그림 4와 같이 Generate report 링크가 있습니다. Generate report 링크를 클릭하면 플러그인 개발자가 새 버전의 플러그인에서 문제를 해결하는 데 도움이 되는 추가 정보가 포함된 대화상자가 표시됩니다. Copy를 클릭하여 텍스트를 클립보드에 저장하면 플러그인 개발자 버그 신고에 정보를 더 쉽게 붙여넣을 수 있습니다.
그림 4. 빌드 분석 도구 경고에 관한 자세한 정보
경고 유형
빌드 분석 도구는 다음과 같은 경고 유형을 보고합니다.
Always run tasks: 항상 실행되는 작업은 모든 빌드에서 다른 작업을 실행시킵니다. 이는 불필요합니다. 이 경고가 표시될 수 있는 두 가지 주요 이유는 다음과 같습니다.
(일반적임) 작업 입력과 출력을 올바르게 선언하지 않았습니다. 이 경우 작업의 입력과 출력을 올바르게 선언해야 합니다.
즉, 가능한 경우 입력과 출력을 직접 선언합니다. 또는 경고를 발생시키는 작업이 서드 파티 플러그인에서 비롯되는 경우 플러그인 버전을 변경합니다.
(일반적이지 않음) 작업의 upToDateWhen이 false로 설정되어 있습니다. 이는 피해야 하는 설정 방식입니다. 이러한 설정은 일부 로직이 false로 평가된 경우 또는 upToDateWhen이 false로 하드코딩된 경우에만 가능합니다. false로 평가된 로직이 있다면 이 결과는 의도된 것일 수 있으므로 경고를 무시할 수도 있습니다. upToDateWhen이 false로 하드코딩된 경우 코드에서 하드코딩을 삭제해야 합니다.
Task setup issues: 이 경고는 출력과 동일한 디렉터리를 선언한 작업과 관련해 생성됩니다. 그러한 작업 출력이 빌드 간에 보존되지 않을 가능성이 높다는 것을 의미합니다. 그러한 작업은 변경사항이 없더라도 항상 실행됩니다. 이 경고를 해결하려면 작업의 출력 디렉터리를 다르게 선언해야 합니다.
즉, 가능한 경우 다른 출력 디렉터리를 직접 선언합니다. 또는 경고를 발생시키는 작업이 서드 파티 플러그인에서 비롯되는 경우 플러그인 버전을 변경합니다.
Non-incremental annotation processor: 이 경고는 주석 프로세서가 비증분 방식일 때 JavaCompile 작업이 항상 비증분 방식으로 실행되도록 하는 상황에서 발생합니다. 이 경고를 해결하려면 증분 방식의 주석 프로세서로 전환하세요.
Configuration cache: 이 경고는 프로젝트에 구성 캐싱이 사용 설정되지 않은 경우에 표시됩니다. 빌드 분석 도구는 빌드 시퀀스를 조회하여 프로젝트가 구성 캐싱과 호환되는지 확인합니다.
호환성 확인이 제대로 된 경우 빌드 분석 도구에서 구성 캐싱을 사용 설정할 수 있습니다.
Check Jetifier: 이 경고는 enableJetifier 플래그가 있고 프로젝트에 사용 설정된 경우에 표시됩니다. 즉, gradle.properties 파일에서 android.enableJetifier=true인 경우입니다. 빌드 분석 도구는 프로젝트의 빌드 성능을 높이고 관리되지 않은 Android 지원 라이브러리에서 이전하기 위해 플래그를 안전하게 삭제할 수 있는지 확인하는 검사를 실행할 수 있습니다.
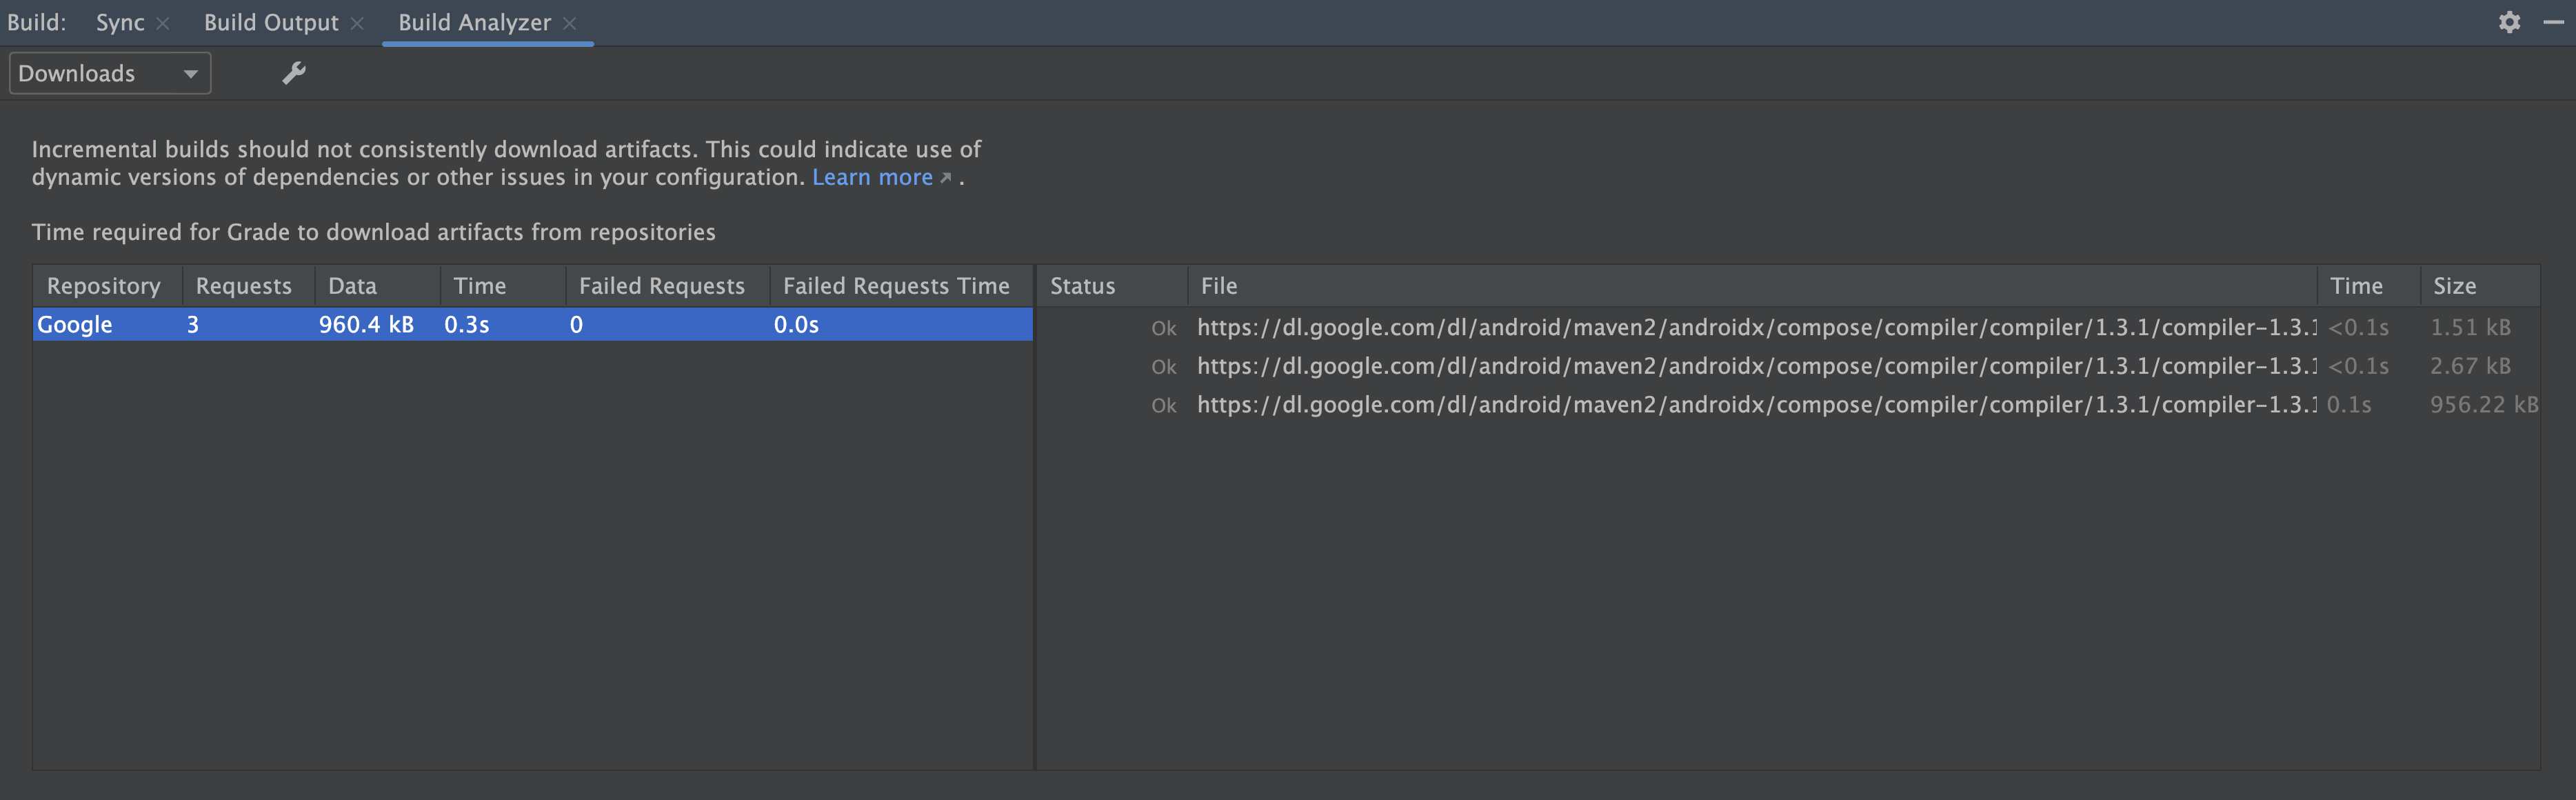
다운로드의 영향 확인
빌드 분석 도구에서 종속 항목 다운로드에 소요된 시간에 관한 요약과 저장소별 다운로드에 관한 자세한 뷰를 제공합니다. 다운로드의 영향을 확인하려면 드롭다운에서 Downloads를 선택합니다. 이 정보는 동기화 창에서도 확인할 수 있습니다.
이 정보를 사용하여 예상치 못한 종속 항목 다운로드가 빌드 성능에 부정적인 영향을 미치는지 확인할 수 있습니다. 이는 아티팩트를 일관되게 다운로드하면 안 되는 증분 빌드에서 특히 중요합니다.
특히 이 정보는 예상치 못한 다운로드를 유발하는 동적 버전의 종속 항목 사용과 같은 구성 문제를 식별하는 데 사용할 수 있습니다.
또한 특정 저장소에 관한 실패한 요청의 수가 많다면 해당 저장소를 삭제하거나 저장소 구성에서 더 아래로 이동해야 한다는 의미일 수 있습니다.
그림 5. 다운로드가 빌드 기간에 미치는 영향을 보여주는 빌드 분석 도구
[Windows만 해당] 바이러스 백신 소프트웨어의 영향 확인
빌드 분석 도구는 바이러스 백신 소프트웨어가 빌드 성능에 영향을 줄 수 있는지 알려줍니다. Windows Defender와 같은 바이러스 백신 소프트웨어가 Gradle에서 사용하는 디렉터리를 실시간으로 검사하는 경우 이 문제가 발생할 수 있습니다. 빌드 분석 도구는 활성 스캔에서 제외할 디렉터리 목록을 권장하고 가능한 경우 Windows Defender 폴더 제외 목록에 추가할 수 있는 링크를 제공합니다.
이 페이지에 나와 있는 콘텐츠와 코드 샘플에는 콘텐츠 라이선스에서 설명하는 라이선스가 적용됩니다. 자바 및 OpenJDK는 Oracle 및 Oracle 계열사의 상표 또는 등록 상표입니다.
최종 업데이트: 2025-07-27(UTC)
[[["이해하기 쉬움","easyToUnderstand","thumb-up"],["문제가 해결됨","solvedMyProblem","thumb-up"],["기타","otherUp","thumb-up"]],[["필요한 정보가 없음","missingTheInformationINeed","thumb-down"],["너무 복잡함/단계 수가 너무 많음","tooComplicatedTooManySteps","thumb-down"],["오래됨","outOfDate","thumb-down"],["번역 문제","translationIssue","thumb-down"],["샘플/코드 문제","samplesCodeIssue","thumb-down"],["기타","otherDown","thumb-down"]],["최종 업데이트: 2025-07-27(UTC)"],[],[],null,["# Troubleshoot build performance with Build Analyzer\n\nUse the Build Analyzer to inspect the build performance of your project. For\neach build you perform, the Build Analyzer tries to present the most important\ninformation so that you can quickly identify and resolve regressions in your\nbuild performance.\n\nFor additional strategies on improving build performance, read\n[Optimize your build speed](/studio/build/optimize-your-build).\n| **Note:** The Build Analyzer doesn't display data for all tasks in your build. Instead, it focuses on only the tasks that determine your build's total duration.\n\nGet started\n-----------\n\nEach time you build your app, the Build Analyzer creates a report and displays\ndata from the latest report in the **Build** window.\n\nTo get started, proceed as follows:\n\n1. If you haven't already done so, build your app in one of the following ways:\n - Click **Build \\\u003e Make Project** from the menu bar.\n - To build an Android App Bundle or APK, click **Build \\\u003e Build Bundle(s)\n / APK(s) \\\u003e Build Bundle(s)** or **Build \\\u003e Build Bundle(s) / APK(s) \\\u003e\n Build APK(s)** from the menu bar.\n2. To open the **Build** window, select **View \\\u003e Tool Windows \\\u003e Build** from the menu bar.\n3. To view the build report in the **Build Analyzer** , click the **Build Analyzer** tab in the **Build** window.\n\nThe data that the Build Analyzer presents might change across builds, so it's\nhelpful to build your project multiple times and compare the data to identify\npatterns.\n\nView plugins with tasks determining the build's duration\n--------------------------------------------------------\n\nWhen you first open the Build Analyzer after completing a build, the window\ndisplays an overview of the build analysis, as shown in figure 1.\n**Figure 1.** The Build Analyzer overview page gives a summary of the findings.\n\nTo see a breakdown of plugins with tasks determining the build's duration, click\n**Plugins with tasks impacting build duration** on the overview page. You can\nalso select **Tasks** from the dropdown and confirm that you're grouping by\nplugin. The graph orders the plugins and their related tasks by the total time\nthey take to complete.\n**Figure 2.** The Build Analyzer provides a breakdown of plugins that affect your build's duration.\n\nView tasks determining the build's duration\n-------------------------------------------\n\nTo view a breakdown of the tasks that contribute to your build's duration, click\n**Tasks impacting build duration** on the overview page or select **Tasks** from\nthe dropdown. If your project uses AGP 8.0 or higher the tasks are grouped by\ncategory by default, so it's easier to identify areas that impact build\nduration. Click on each child task to learn more about its execution.\n**Figure 3.** The Build Analyzer provides a breakdown of tasks most responsible for your build's duration.\n\nInspect warnings\n----------------\n\nIf the Build Analyzer detects that some tasks could be configured to run more\nefficiently, it provides a warning. To see all the warnings the Build Analyzer\nhas identified for your build, click on **All warnings** on the overview page or\nselect **Warnings** from the dropdown.\n\nSome warnings have a **Generate report** link, as shown in figure 4. When you\nclick the **Generate report** link, a dialog appears with additional information\nthat might help the plugin developer resolve the issue in a new version of the\nplugin. Click **Copy** to save the text to your clipboard to more easily paste\nthe information into a bug report to the plugin developer.\n**Figure 4.** Detailed information about Build Analyzer warnings.\n\n### Warning types\n\nThe Build Analyzer reports the following warning types:\n\n- **Always run tasks**: An always running task makes other tasks run on every\n build, which is unnecessary. There are two main reasons why you might see this\n warning:\n\n - (More common) You did not declare task inputs and outputs correctly. If this\n is the case, you should [properly declare the inputs and outputs for your\n tasks](https://docs.gradle.org/current/userguide/more_about_tasks.html#sec:up_to_date_checks).\n This means declaring inputs and outputs yourself where you can or changing\n plugin versions if the tasks triggering the warning are from third-party\n plugins.\n\n - (Less common) A task has `upToDateWhen` set to false, which should be\n avoided. It could be that there is some logic that evaluates to false or that\n `upToDateWhen` is hardcoded to be false. If there is logic that evaluates to\n false, this outcome might be intentional, and you might choose to ignore the\n warning. If `upToDateWhen` is hardcoded to be false, you should remove the\n hardcoding from your code.\n\n- **Task setup issues** : This warning is generated for tasks that declare the\n same directory as outputs. This means that those tasks outputs are most likely\n not being preserved between builds and those tasks always run, even when\n there are no changes. To address this warning you should\n [declare different output directories for your\n tasks](https://docs.gradle.org/current/userguide/more_about_tasks.html#sec:up_to_date_checks).\n This means declaring different output directories yourself where you can or\n changing plugin versions if the tasks triggering the warning are from\n third-party plugins.\n\n- **Non-incremental annotation processor:** This warning is generated in\n situations where an annotation processor is non-incremental and causes the\n `JavaCompile` task to always run non-incrementally. To address this warning,\n [switch to an incremental annotation\n processor](/studio/build/optimize-your-build?utm_source=android-studio#incremental-annotation-processor-support).\n\n- **Configuration cache:** This warning is presented if [configuration\n caching](https://medium.com/androiddevelopers/configuration-caching-deep-dive-bcb304698070)\n is not enabled for your project. The Build Analyzer walks through a sequence of\n builds to check whether your project is compatible with configuration caching.\n If the compatibility checks are successful, you can turn configuration caching\n on from the Build Analyzer.\n\n- **Check Jetifier:** This warning is presented if the\n [`enableJetifier` flag is present](/jetpack/androidx/migrate)\n and enabled in your project; that is, if you have `android.enableJetifier=true`\n in your `gradle.properties` file. The Build Analyzer can perform a check to see\n whether the flag can be safely removed to enable your project to have better\n build performance and migrate away from the unmaintained Android Support\n libraries.\n\nCheck download impact\n---------------------\n\nBuild Analyzer provides a summary of time spent downloading dependencies and a\ndetailed view of downloads per repository. To check the impact of downloads,\nselect **Downloads** from the dropdown. This info is also available in the\n[**Sync**](/studio/run#gradle-console) window.\n\nYou can use this information to determine whether unexpected dependency\ndownloads are negatively impacting your build performance. This is especially\nimportant during incremental builds, which shouldn't consistently download\nartifacts.\n\nSpecifically, you can use this information to identify configuration issues,\nsuch as use of dynamic versions of dependencies that cause unexpected downloads.\nAlso, if you see a high number of failed requests for a specific repository, it\ncould indicate that the repository should be removed or moved lower in your\nrepository configuration.\n**Figure 5.** The Build Analyzer shows the impact of downloads on build duration.\n\n\\[Windows-only\\] Check antivirus software impact\n------------------------------------------------\n\nBuild Analyzer informs you if antivirus software might be impacting your build\nperformance. This can happen if antivirus software, such as Windows Defender,\nis doing real-time scanning of directories used by Gradle. Build Analyzer\nrecommends a list of directories to exclude from active scanning and, if\npossible, it offers a link to add them to the Windows Defender folder exclusion\nlist."]]