
Traceview is deprecated. If you're using Android
Studio 3.2 or later, you should instead use
CPU Profiler to inspect
.trace files captured by
instrumenting your app
with the Debug
class, record new method traces, save .trace files, and inspect
real-time CPU usage of your app's processes.
Traceview is a tool that provides a graphical representations of
trace logs. You can generate the logs by instrumenting your code with the
Debug class. This method of tracing is
very precise because you can specify exactly where in the code you want to start
and stop logging trace data. If you haven't yet generated these trace logs and
saved them from your connected device to your local machine, go to Generate
trace logs by instrumenting your app.
Inspecting these logs using Traceview helps you debug your app and
profile its performance.
Tip: You can use
dmtracedump from the command-line to generate a graphical
call-stack diagrams of your trace log files.
If you don't need to view trace logs that you have recorded by instrumenting
your app with the Debug
class, you can use the CPU profiler
included in Android Studio 3.0 and higher to inspect your app's threads and record
method traces.
Open a trace log using Traceview
To open a trace log with Traceview from Android Studio, proceed as follows:
- Start Android Device Monitor.
- In the Android Device Monitor, select File > Open File.
- Navigate to the
.tracefile you want to inspect. - Click Open.
Note: If you are trying to view the trace logs
of an app that is built with code shrinking enabled (such as a release build),
some method and member names might be obfuscated. You can use the ProGuard
mapping.txt file to figure out the original unobfuscated names.
For more information on this file, see
Decode an obfuscated
stack trace.
Note: Running traceview from the
command line has been deprecated.
Traceview overview
After opening a trace log, Traceview displays log data using the following two panes:
- A timeline pane that describes when each thread enters and exits a method
- A profile pane that summarizes the execution of each thread over the period of the trace log
The sections below provide addition information about the traceview output panes.
Timeline pane
Figure 1 shows a close up of the timeline pane. Each thread's execution is shown in its own row, with the elapsed time increasing towards the right. Each method is shown in varying colors. The thin lines underneath the first row show the children (from entry to exit) of the selected method.
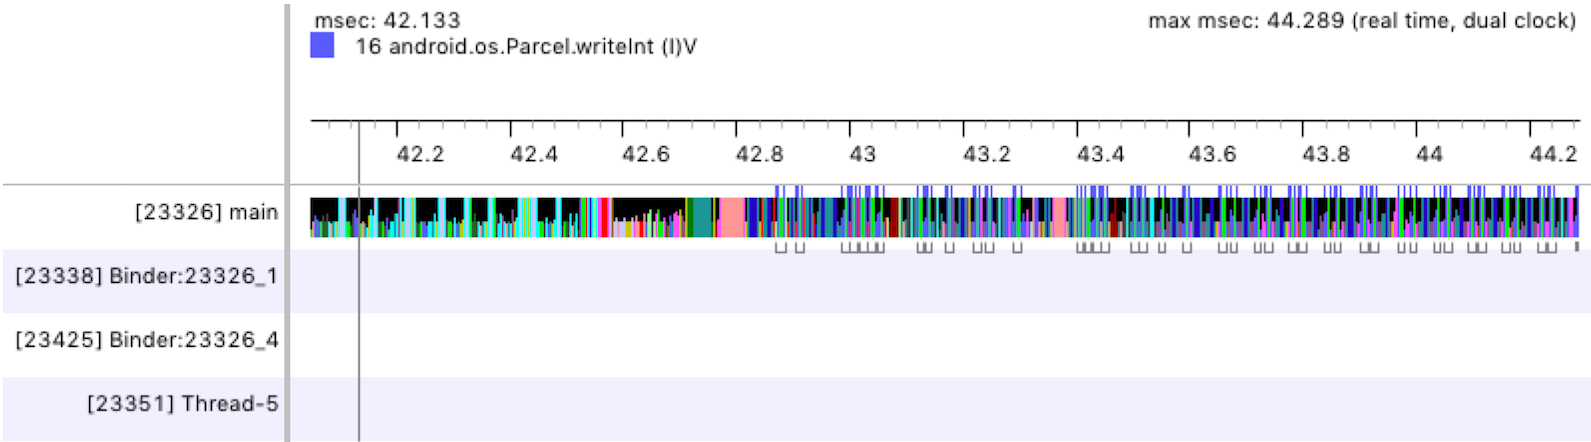
Figure 1. The Traceview timeline pane.
Profile pane
As shown in figure 2, the profile pane provides a list of each method the system executed over the period of the trace log and the time spent executing those methods. A method that calls another method is referred to as the parent, and methods that a parent calls are referred to as its children. When you select a method by clicking on it, it displays both its parents and its children under two separate nodes.
For each method (top-level node), the table shows both its inclusive and exclusive times (in milliseconds) as well as the percentage of the total time. Exclusive time is the time spent executing the method's own code, while inclusive time is the time spent executing the method's own code plus the time spent executing its children. Timing information is also reported in terms of CPU time and real time. CPU time considers only the time that the thread is actively using CPU time, and real time provides absolute timing information from the moment your app enters a method to when it exits that method—regardless of whether the thread is active or sleeping.
For each top-level node in the profile pane, the Calls + Rec, Calls/Total column in the table (not shown in figure 2) reports the number of calls to the method and the number of recursive calls. Or, for parent and child methods, this column shows the number of calls in which the method was a child or parent of the method in the top-level node.
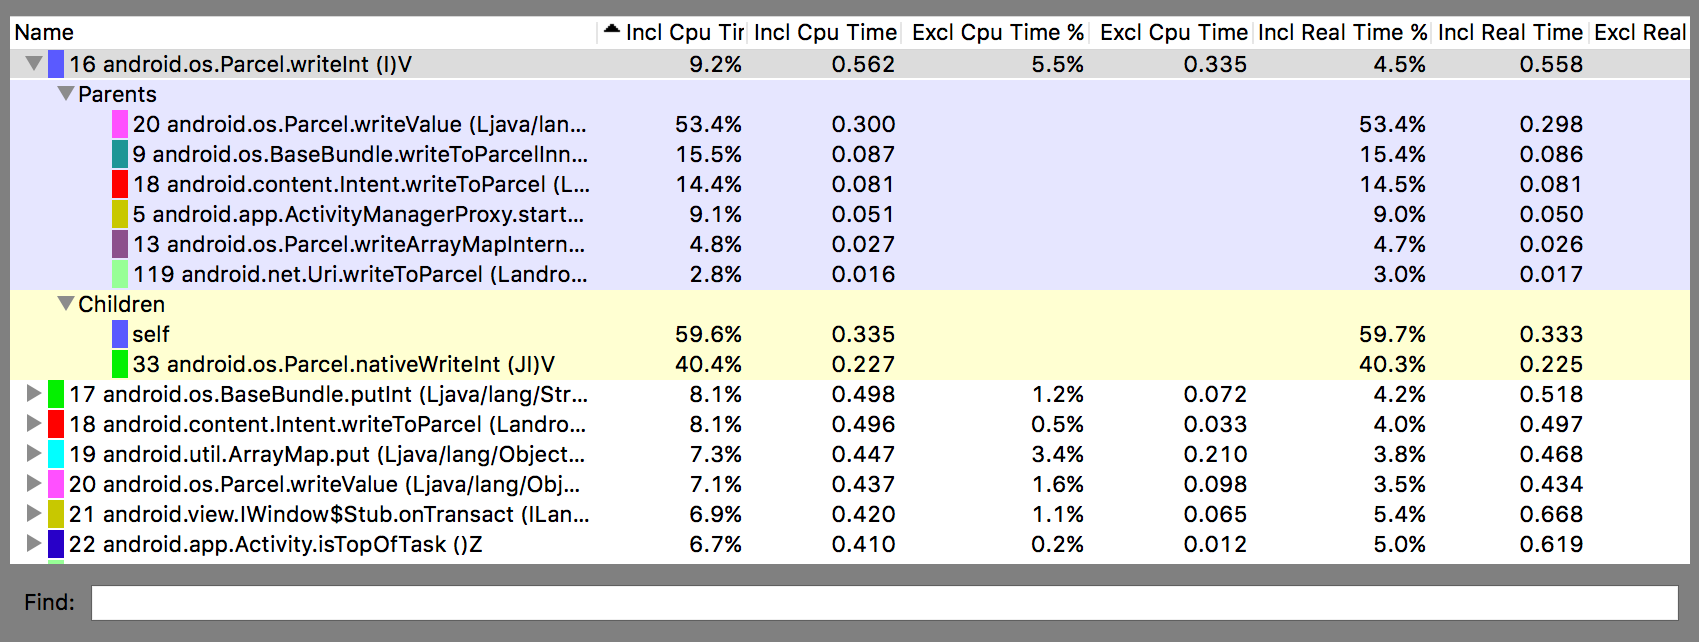
Figure 2. The Traceview profile pane.
Traceview known issues
Traceview logging does not handle threads well, resulting in the following issues:
- If a thread exits during profiling, the thread name is not emitted (fixed in Android 5.1 and later);
- The VM reuses thread IDs. If a thread stops and another starts, they may get the same ID.