
階層檢視器已淘汰。如果您使用 Android Studio 3.1 或以上版本,請改為在執行階段中使用「版面配置檢查器」檢查應用程式的檢視區塊階層。如要描述應用程式版面配置的轉譯速度,請使用Window.OnFrameMetricsAvailableListener,詳情請參閱「本篇網誌文章」。
「階層檢視器」是 Android 裝置監視器內建的工具,可於版面配置階層中評估每個檢視畫面的版面配置速度。其可協助您找出因資料檢視區塊階層結構而造成的效能瓶頸。
注意:階層檢視器已不再開發。如要檢查執行階段中資料檢視區塊階層的屬性,請改用 Android Studio 中的 版面配置檢查器。不過,版面配置檢查器目前不會針對版面配置效能提供剖析詳細資料。
本頁將介紹階層檢視器,並逐步說明如何剖析您的版面配置。
做好準備
如果您使用的是 Android 模擬器,則可以略過這部分。在其他情況下,您必須按照以下說明設定裝置。
附註:裝置必須搭載 Android 4.1 以上版本。
- 在裝置上啟用「開發人員選項」。
- 在您的開發機器上設定環境變數
ANDROID_HVPROTO=ddm。此變數會告知階層檢視器使用
ddm通訊協定連線至裝置,此與 DoubleClickS 通訊協定相同。請記得,在連上裝置的主機上只能有一項程序,因此您必須終止其他任何 DDMS 工作階段,才能執行階層式檢視器。
啟動階層檢視器
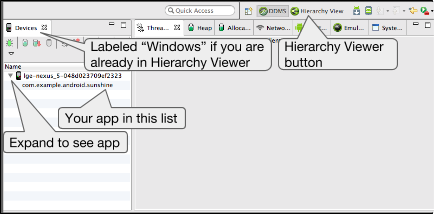
圖 1 Android 裝置監視器
- 將裝置連接到電腦。如果畫面上出現對話方塊,其中顯示「允許 USB 偵錯嗎?」提示訊息,請輕觸「確定」。
- 在 Android Studio 中開啟專案,並在裝置上建構及執行。
- 啟動 Android Device Monitor。Android Studio 可能會顯示「Disable adb integration」對話方塊,這是因為一次只有一個程序可透過 ADB 連接至裝置,並且 Android Device Monitor 正在要求建立連線。按一下「Yes」。
圖 1 呈現 Android Device 監視器最初的顯示畫面。
- 在選單列中,依序選取 「Window」 >「Open Perspective」,然後按一下 「Hierarchy View」。
您應該會看見與圖 2 相似的排列方式。如果沒有,請依序選取「Window」>「Reset Perspective」返回預設版面配置。
- 在左側的「Windows」分頁中,按兩下應用程式的套件名稱。然後在窗格中填入應用程式的資料檢視區塊階層。
熟悉工具的使用方式

圖 2. 階層檢視器窗格。
階層檢視器提供下列窗格 (如圖 2 所示):
- 「Tree View」(中心):顯示資料檢視區塊階層的樹狀檢視。如要拖曳及縮放樹狀結構,請使用滑鼠以及底部的縮放控制項。各個節點代表其為
View類別名稱和 ID 名稱。 - 「Tree Overview」 (右上方):大致瞭解應用程式的完整檢視區塊階層。移動灰色矩形,以變更在「樹狀檢視」中顯示的可視區域。
- 版面配置檢視 (右下方):顯示版面配置的線框圖。目前選擇的描繪外框以紅色顯示,其父項檢視畫面則為淺紅色。
在此處按一下檢視畫面,系統也會在「樹狀檢視」中選取該資料檢視,反之亦然。
資料檢視區塊階層是版面配置的數據匯報,因此不會自動更新。如要更新階層檢視,請按一下「Reload the view hierarchy」 。
。
如要撤銷檢視畫面 (要求系統在下次版面配置更新時呼叫 onDraw()),請選取階層中的檢視畫面,然後按一下「Invalidate the layout」  (相當於呼叫檢視畫面中的
 invalidate())。如想要求檢視區塊 (以及任何子項),請按一下「Request lay out」 。
。
如果您要前往其他應用程式,則必須在左側窗格中的「Windows」分頁中選取該應用程式,即可檢視其檢視區塊階層。
如要查看檢視畫面的測量、版面配置及繪製時間等詳細資料 (如圖 3 所示),請按一下「樹狀檢視」中的檢視畫面。按兩下檢視模式,即可放大圖片。
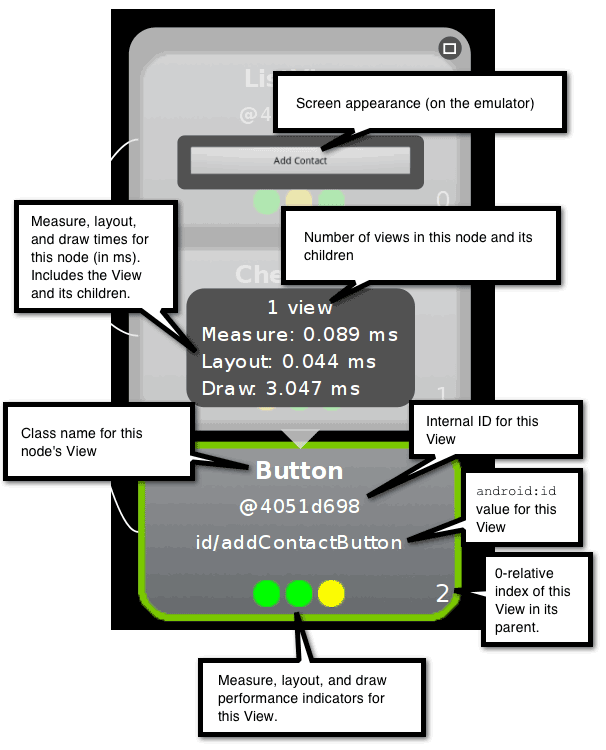
圖 3. 顯示節點部分。
如要查看檢視區塊的屬性,請按一下左側窗格中的「View Properties」分頁標籤,如圖 4 所示。
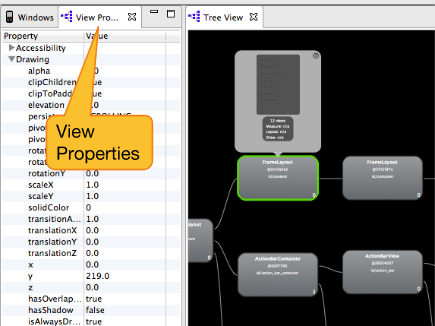
圖 4「View Properties」分頁的位置。
如要將版面配置圖層的螢幕截圖儲存至 Adobe Photoshop (PSD) 檔案,請按一下工具列中的「Capture the windowlayers」圖示  。系統會將每個檢視畫面儲存為個別圖層,因此只要隱藏和調整各個檢視畫面,就能輕鬆建立新模型。
剖析版面配置
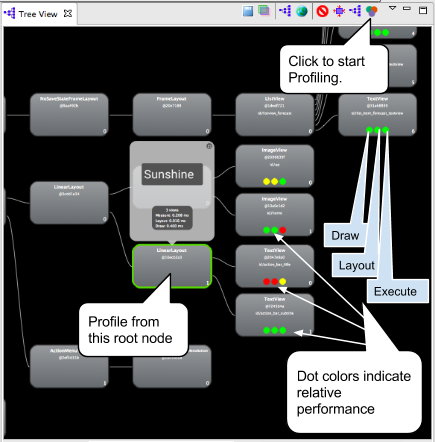
圖 5. 剖析完成後再檢視區塊階層。
現在,您已熟悉工具的運用方式,其可用來分析檢視區塊階層,並解讀結果。
- 在「Tree View」或「Layout View」中,按一下您想剖析的子項檢視節點。
- 如要開始剖析,請按一下「Tree View」頂端的「Obtain layout times」
 。
。如果是大型資料檢視區塊階層,則可能需要數秒鐘才能完成剖析。
每個所選節點的子檢視畫面都有三個點,分別是綠色、黃色或紅色。
- 左側點代表轉譯管道的繪圖程序。
- 中間點代表版面配置階段。
- 右側點則代表執行階段。
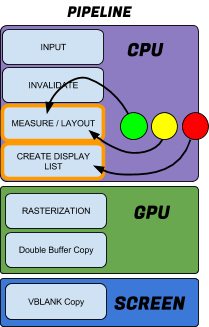
圖 6色點與轉譯管道
之間的關聯。
這些點大致對應到處理管道的測量、版面配置和繪圖階段。點的顏色代表該節點相對於本機系列中其他所有剖析節點的相對效能。
- 「綠色」代表資料檢視的算繪速度至少比其他檢視畫面的一半快。
- 「黃色」代表檢視畫面的算繪速度比其他檢視畫面的一半快。
- 「紅色」表示該檢視畫面屬於最慢的一半檢視畫面之一。
解譯結果
「階層式檢視器」會測量每個節點相對於同層級檢視畫面的效能,因此如果設定檔的效能都相同,則設定檔的紅色節點會維持一致,但不一定代表紅色的節點成效不佳 (只代表本機檢視區塊群組最慢的檢視畫面)。
「階層式檢視器」能光柵化版面配置,取得時間資訊。光柵化程序是擷取高層級原始物件 (例如圓形或向量字型),並轉換成螢幕中的像素的過程。光柵化通常會由裝置上的 GPU 完成,但如果是軟體光柵化,則使用一般軟體的 CPU 進行算繪。其表示回報的絕對時間是相對的,但資料顯示方式會因裝置和開發機器的整體 CPU 工作負載數量和變化而有所不同。因此,該工具不會反映實際效能速度,因此您應多次剖析,以便瞭解平均的測量結果。
如果您的應用程式發生非預期的運作緩慢問題,紅色節點就是一項潛在問題。相對設定中,系統一律會有最慢的節點;只要確認該節點是預期的節點即可。以下範例將說明如何解讀紅點。
- 您可以在節能綠葉節點中查看紅點,或檢視只有少數子項的群組。這可能是問題所在。您的應用程式可能沒有緩慢的反應,或是因為裝置執行速度緩慢而需要處理,但請留意發生紅點的原因。Systrace 或 Traceview 可提供額外資訊。
- 如果您有一個檢視區塊群組,當中有多個子項且顯示紅色測量階段,請參考子項來瞭解其表現。
- 有黃或甚至紅點的檢視畫面在裝置上執行效能可能較慢。這時實際數據即可派上用場。Systrace 或 Traceview 可提供額外資訊。
- 如果階層的根檢視畫面有紅色測量階段、紅色版面配置階段和黃色繪圖階段,這雖然相當典型,因為這是所有其他檢視畫面的父項,直到子項完成後,其版面配置才會完成。
- 如果樹狀圖中有超過 20 次檢視畫面的節能綠葉節點出現紅色繪圖階段,則會發生問題。檢查
onDraw()方法,確認程式碼不應出現於此。
如需更多版面配置提示,請參閱改善版面配置效能。