dmtracedump
컬렉션을 사용해 정리하기
내 환경설정을 기준으로 콘텐츠를 저장하고 분류하세요.
dmtracedump
는 트레이스 로그 파일에서 그래픽 호출 스택 다이어그램을 생성하는 도구입니다. 이 도구에서는 Graphviz Dot 유틸리티를 사용하여 그래픽 출력을 작성하므로 dmtracedump
를 실행하기 전에 Graphviz를 설치해야 합니다. 트레이스 로그를 생성하고 연결된 기기에서 로컬 시스템으로 아직 저장하지 않은 경우 앱을 계측하여 트레이스 로그 생성으로 이동하세요.
dmtracedump
도구에서는 호출 스택 데이터를 트리 다이어그램으로 생성합니다. 여기서 각 노드는 메서드 호출을 나타냅니다. 트리 다이어그램에서는 화살표를 사용하여 상위 노드에서 하위 노드로의 호출 흐름을 표시합니다. 아래 다이어그램은 dmtracedump
의 샘플 출력입니다.
dmtracedump
도구는 Android SDK 도구 패키지에 제공되며 android-sdk/platform-tools/
에 위치합니다.
구문
dmtracedump의 사용법은 다음과 같습니다.
dmtracedump [-ho] [-s sortable] [-d trace-base-name] [-g outfile] trace-base-name
그런 다음 도구에서는 트레이스 로그 데이터를 trace-base-name.data
와 trace-base-name.key
에서 로드합니다.
전역 옵션
전역 옵션 |
설명 |
-h |
HTML 출력을 사용 설정합니다. |
-o |
프로파일링 대신 트레이스 파일을 덤프합니다. |
명령어 및 명령어 옵션
명령어 및 옵션 |
설명 |
-d trace-base-name |
이 트레이스 이름으로 차이를 확인합니다. |
-g outfile |
outfile 로 출력을 생성합니다. |
-s sortable |
정렬 가능한 자바스크립트 파일 위치의 URL 기본 |
-t percent |
그래프에 하위 노드를 포함하기 위한 최소 임계값(하위 노드의 포괄 시간을 상위 노드 포괄 시간의 비율로). 이 옵션이 사용되지 않는 경우 기본 임계값은 20%입니다. |
출력
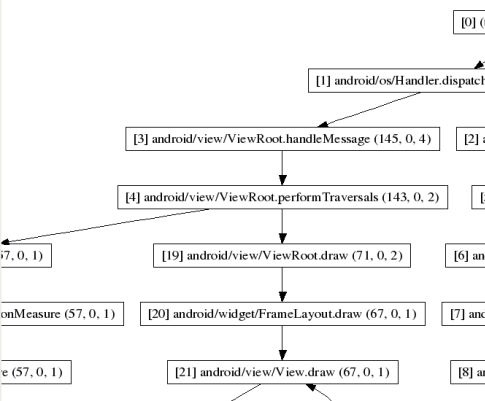
그림 1. dmtracedump의 스크린샷
그래프의 노드별로 dmtracedump
에서는 다음 정보를 표시합니다.
ref callname (inc-ms, exc-ms,numcalls)
ref
— 트레이스 로그에 사용된 호출 참조 번호
inc-ms
— 포괄적 경과 시간(메서드에 소요된 시간(밀리초), 모든 하위 메서드 포함)
exc-ms
— 배타적 경과 시간(메서드에 소요된 시간(밀리초), 모든 하위 메서드 포함하지 않음)
numcalls
— 호출 수
이 페이지에 나와 있는 콘텐츠와 코드 샘플에는 콘텐츠 라이선스에서 설명하는 라이선스가 적용됩니다. 자바 및 OpenJDK는 Oracle 및 Oracle 계열사의 상표 또는 등록 상표입니다.
최종 업데이트: 2025-07-27(UTC)
[[["이해하기 쉬움","easyToUnderstand","thumb-up"],["문제가 해결됨","solvedMyProblem","thumb-up"],["기타","otherUp","thumb-up"]],[["필요한 정보가 없음","missingTheInformationINeed","thumb-down"],["너무 복잡함/단계 수가 너무 많음","tooComplicatedTooManySteps","thumb-down"],["오래됨","outOfDate","thumb-down"],["번역 문제","translationIssue","thumb-down"],["샘플/코드 문제","samplesCodeIssue","thumb-down"],["기타","otherDown","thumb-down"]],["최종 업데이트: 2025-07-27(UTC)"],[],[],null,["# dmtracedump\n\n`dmtracedump` is a tool that generates\ngraphical call-stack diagrams from trace log files. The tool uses the Graphviz\nDot utility to create the graphical output, so you need to install Graphviz\nbefore running `dmtracedump`. If you haven't yet generated trace logs and\nsaved them from your connected device to your local machine, go to\n[Generate trace logs by instrumenting your app](/studio/profile/generate-trace-logs).\n\nThe `dmtracedump` tool generates the call stack data as a tree diagram, where each\nnode represents a method call. It shows call flow (from parent node to child nodes)\nusing arrows. The diagram below shows a sample output of `dmtracedump`.\n\nThe `dmtracedump` tool is provided in the Android SDK Tools package and is\nlocated in \u003cvar translate=\"no\"\u003eandroid-sdk\u003c/var\u003e`/platform-tools/`.\n\nSyntax\n------\n\nThe usage for dmtracedump is: \n\n```\ndmtracedump [-ho] [-s sortable] [-d trace-base-name] [-g outfile] trace-base-name\n```\n\nThe tool then loads trace log data from \u003cvar translate=\"no\"\u003etrace-base-name\u003c/var\u003e`.data` and\n\u003cvar translate=\"no\"\u003etrace-base-name\u003c/var\u003e`.key`.\n\n### Global options\n\n| Global options | Description |\n|----------------|------------------------------------------|\n| `-h` | Turn on HTML output |\n| `-o` | Dump the trace file instead of profiling |\n\n### Commands and command options\n\n| Commands and options | Description |\n|------------------------------------------------|---------------------------------------------------------------------------------------------------------------------------------------------------------------------------------------|\n| `-d `\u003cvar translate=\"no\"\u003etrace-base-name\u003c/var\u003e | Diff with this trace name |\n| `-g `\u003cvar translate=\"no\"\u003eoutfile\u003c/var\u003e | Generate output to \u003cvar translate=\"no\"\u003eoutfile\u003c/var\u003e |\n| `-s `\u003cvar translate=\"no\"\u003esortable\u003c/var\u003e | URL base to the location of the sortable javascript file |\n| `-t `\u003cvar translate=\"no\"\u003epercent\u003c/var\u003e | Minimum threshold for including child nodes in the graph (child's inclusive time as a percentage of parent inclusive time). If this option is not used, the default threshold is 20%. |\n\nOutput\n------\n\n\n**Figure 1.** Screenshot of dmtracedump\n\n\u003cbr /\u003e\n\nFor each node in the graph, `dmtracedump` shows the following\ninformation: \n\n```\nref callname (inc-ms, exc-ms,numcalls)\n```\n\n- \u003cvar translate=\"no\"\u003eref\u003c/var\u003e --- Call reference number, as used in trace logs\n- \u003cvar translate=\"no\"\u003einc-ms\u003c/var\u003e --- Inclusive elapsed time (milliseconds spent in method, including all child methods)\n- \u003cvar translate=\"no\"\u003eexc-ms\u003c/var\u003e --- Exclusive elapsed time (milliseconds spent in method, not including any child methods)\n- \u003cvar translate=\"no\"\u003enumcalls\u003c/var\u003e --- Number of calls"]]