dmtracedump
透過集合功能整理內容
你可以依據偏好儲存及分類內容。
dmtracedump
這項工具可
追蹤記錄檔案中的圖形呼叫堆疊圖表。這項工具使用 Graphviz
使用 Dot 公用程式建立圖形輸出,因此您必須安裝 Graphviz
執行 dmtracedump
之前。如果您尚未產生追蹤記錄,
會將這些內容從已連結的裝置儲存至本機電腦
檢測應用程式以產生追蹤記錄。
dmtracedump
工具會以樹狀圖的形式產生呼叫堆疊資料,其中
node 代表方法呼叫顯示呼叫流程 (從父項節點到子節點)
並按下箭頭即可下圖顯示 dmtracedump
的輸出內容範例。
dmtracedump
工具隨附於 Android SDK Tools 套件中,
位於 android-sdk/platform-tools/
。
語法
dmtracedump 的使用方法如下:
dmtracedump [-ho] [-s sortable] [-d trace-base-name] [-g outfile] trace-base-name
然後工具會載入 trace-base-name.data
和
trace-base-name.key
。
全域選項
全域選項 |
說明 |
-h |
開啟 HTML 輸出 |
-o |
傾印追蹤檔案而不剖析 |
指令和指令選項
指令和選項 |
說明 |
-d trace-base-name |
與此追蹤記錄名稱的差異 |
-g outfile |
產生輸出至 outfile |
-s sortable |
可排序 JavaScript 檔案位置的網址基底 |
-t percent |
在圖表中加入子項節點的最低閾值 (子項收錄時間做為
父項收錄時間的百分比)。如果不使用這個選項,則採用預設閾值
20% |
輸出
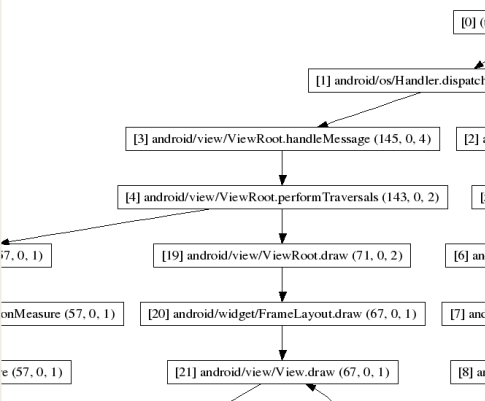
圖 1. dmtracedump 螢幕截圖
對於圖表中每個節點,dmtracedump
會顯示下列內容:
每個 ACL 都由一或多個項目組成
而這些項目包含兩項資訊
ref callname (inc-ms, exc-ms,numcalls)
ref
— 呼叫追蹤記錄使用的參考編號
inc-ms
— 包含經過時間 (在方法中花費的毫秒數,
包括所有子方法)
exc-ms
— 排除經過時間 (在方法中花費的毫秒數,
不含任何子項方法)
numcalls
— 呼叫次數
這個頁面中的內容和程式碼範例均受《內容授權》中的授權所規範。Java 與 OpenJDK 是 Oracle 和/或其關係企業的商標或註冊商標。
上次更新時間:2025-07-27 (世界標準時間)。
[[["容易理解","easyToUnderstand","thumb-up"],["確實解決了我的問題","solvedMyProblem","thumb-up"],["其他","otherUp","thumb-up"]],[["缺少我需要的資訊","missingTheInformationINeed","thumb-down"],["過於複雜/步驟過多","tooComplicatedTooManySteps","thumb-down"],["過時","outOfDate","thumb-down"],["翻譯問題","translationIssue","thumb-down"],["示例/程式碼問題","samplesCodeIssue","thumb-down"],["其他","otherDown","thumb-down"]],["上次更新時間:2025-07-27 (世界標準時間)。"],[],[],null,["# dmtracedump\n\n`dmtracedump` is a tool that generates\ngraphical call-stack diagrams from trace log files. The tool uses the Graphviz\nDot utility to create the graphical output, so you need to install Graphviz\nbefore running `dmtracedump`. If you haven't yet generated trace logs and\nsaved them from your connected device to your local machine, go to\n[Generate trace logs by instrumenting your app](/studio/profile/generate-trace-logs).\n\nThe `dmtracedump` tool generates the call stack data as a tree diagram, where each\nnode represents a method call. It shows call flow (from parent node to child nodes)\nusing arrows. The diagram below shows a sample output of `dmtracedump`.\n\nThe `dmtracedump` tool is provided in the Android SDK Tools package and is\nlocated in \u003cvar translate=\"no\"\u003eandroid-sdk\u003c/var\u003e`/platform-tools/`.\n\nSyntax\n------\n\nThe usage for dmtracedump is: \n\n```\ndmtracedump [-ho] [-s sortable] [-d trace-base-name] [-g outfile] trace-base-name\n```\n\nThe tool then loads trace log data from \u003cvar translate=\"no\"\u003etrace-base-name\u003c/var\u003e`.data` and\n\u003cvar translate=\"no\"\u003etrace-base-name\u003c/var\u003e`.key`.\n\n### Global options\n\n| Global options | Description |\n|----------------|------------------------------------------|\n| `-h` | Turn on HTML output |\n| `-o` | Dump the trace file instead of profiling |\n\n### Commands and command options\n\n| Commands and options | Description |\n|------------------------------------------------|---------------------------------------------------------------------------------------------------------------------------------------------------------------------------------------|\n| `-d `\u003cvar translate=\"no\"\u003etrace-base-name\u003c/var\u003e | Diff with this trace name |\n| `-g `\u003cvar translate=\"no\"\u003eoutfile\u003c/var\u003e | Generate output to \u003cvar translate=\"no\"\u003eoutfile\u003c/var\u003e |\n| `-s `\u003cvar translate=\"no\"\u003esortable\u003c/var\u003e | URL base to the location of the sortable javascript file |\n| `-t `\u003cvar translate=\"no\"\u003epercent\u003c/var\u003e | Minimum threshold for including child nodes in the graph (child's inclusive time as a percentage of parent inclusive time). If this option is not used, the default threshold is 20%. |\n\nOutput\n------\n\n\n**Figure 1.** Screenshot of dmtracedump\n\n\u003cbr /\u003e\n\nFor each node in the graph, `dmtracedump` shows the following\ninformation: \n\n```\nref callname (inc-ms, exc-ms,numcalls)\n```\n\n- \u003cvar translate=\"no\"\u003eref\u003c/var\u003e --- Call reference number, as used in trace logs\n- \u003cvar translate=\"no\"\u003einc-ms\u003c/var\u003e --- Inclusive elapsed time (milliseconds spent in method, including all child methods)\n- \u003cvar translate=\"no\"\u003eexc-ms\u003c/var\u003e --- Exclusive elapsed time (milliseconds spent in method, not including any child methods)\n- \u003cvar translate=\"no\"\u003enumcalls\u003c/var\u003e --- Number of calls"]]