Traceview로 트레이스 로그 검사
컬렉션을 사용해 정리하기
내 환경설정을 기준으로 콘텐츠를 저장하고 분류하세요.
Traceview의 지원이 중단되었습니다. Android 스튜디오 3.2 이상을 사용하는 경우 대신 CPU 프로파일러를 통해 Debug
클래스로 앱을 계측하여 캡처된 .trace
파일을 검사하고 새로운 메서드 트레이스를 기록하며 .trace
파일을 저장하고 앱 프로세스의 실시간 CPU 사용량을 검사해야 합니다.
Traceview는 트레이스 로그를 그래픽으로 표시하는 도구입니다. Debug
클래스로 코드를 계측하여 로그를 생성할 수 있습니다. 트레이스 데이터 로깅을 시작하고 중지하려는 코드 내 위치를 정확히 지정할 수 있으므로 이 트레이스 메서드는 매우 정확합니다. 아직 이러한 트레이스 로그를 생성하여 연결된 기기에서 로컬 머신에 저장하지 않은 경우 앱을 계측하여 트레이스 로그 생성을 참고하세요. Traceview를 사용하여 이러한 로그를 검사하면 앱을 디버그하고 성능을 프로파일링하는 데 도움이 됩니다.
팁: 명령줄에서 dmtracedump
를 사용하여 트레이스 로그 파일의 그래픽 호출 스택 다이어그램을 생성할 수 있습니다.
Debug
클래스로 앱을 계측하여 기록한 트레이스 로그를 볼 필요가 없다면 Android 스튜디오 3.0 이상에 포함된 CPU 프로파일러를 사용하여 앱 스레드를 검사하고 메서드 트레이스를 기록할 수 있습니다.
Traceview를 사용하여 트레이스 로그 열기
Android 스튜디오에서 Traceview를 사용하여 트레이스 로그를 열려면 다음과 같이 진행하세요.
- Android Device Monitor를 시작합니다.
- Android Device Monitor에서 File > Open File을 선택합니다.
- 검사하려는
.trace
파일을 찾습니다.
- Open을 클릭합니다.
참고: 코드 축소가 사용 설정되어 빌드(예: 출시 빌드)된 앱의 트레이스 로그를 보려고 하면 일부 메서드와 멤버 이름이 난독화될 수 있습니다. ProGuard mapping.txt
파일을 사용하여 난독화되지 않은 원래 이름을 알아낼 수 있습니다.
이 파일에 관한 자세한 내용은 난독화된 스택 트레이스 디코딩을 참고하세요.
참고: 명령줄에서 traceview
실행이 지원 중단되었습니다.
Traceview 개요
트레이스 로그를 열면 Traceview가 다음과 같은 두 개의 창을 사용하여 로그 데이터를 표시합니다.
- 타임라인 창: 각 스레드가 메서드에 들어오고 나가는 시기를 설명합니다.
- 프로필 창: 트레이스 로그 기간에 실행되는 각 스레드를 요약합니다.
다음 섹션에서는 traceview 출력 창에 관한 추가 정보를 제공합니다.
타임라인 창
그림 1은 타임라인 창의 확대 화면을 보여줍니다. 각 스레드의 실행은 고유 행에 표시되며, 경과 시간은 오른쪽으로 증가합니다.
각 메서드는 다양한 색상으로 표시됩니다. 첫 번째 행 아래의 가는 선은 선택한 메서드의 하위 요소(시작부터 종료까지)를 표시합니다.
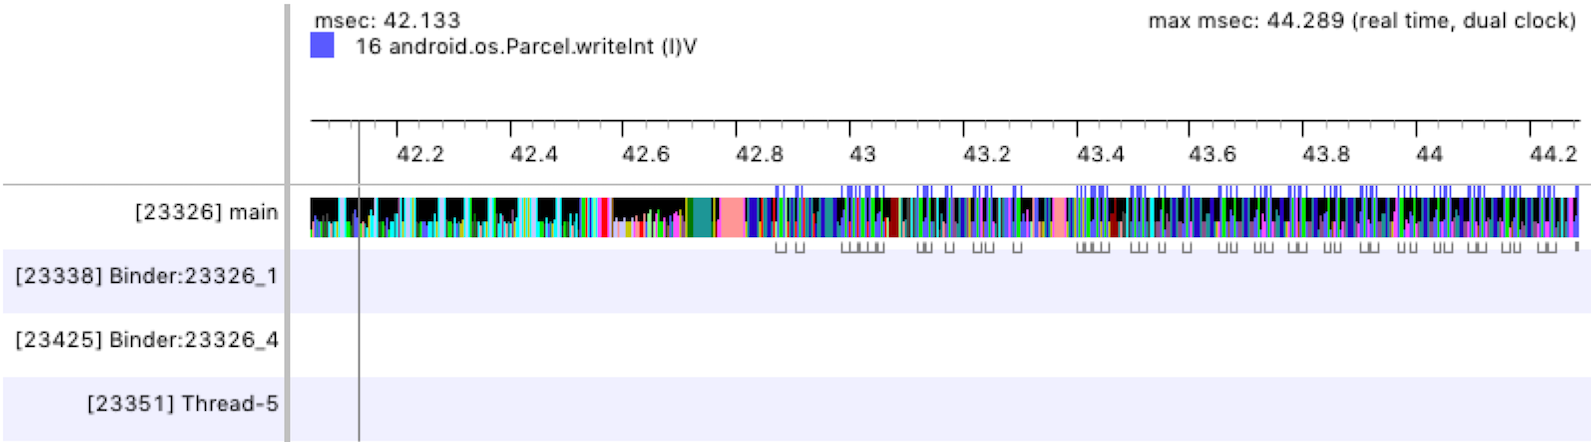
그림 1.
Traceview 타임라인 창
프로필 창
그림 2에 표시된 것처럼 프로필 창에는 트레이스 로그 기간 동안 시스템에서 실행한 각 메서드와 이러한 메서드를 실행하는 데 소요된 시간의 목록이 제공됩니다. 다른 메서드를 호출하는 메서드를 상위 메서드라고 하고 상위 메서드가 호출하는 메서드를 하위 메서드라고 합니다. 메서드를 클릭하여 선택하면 이 메서드의 상위 및 하위 메서드가 모두 두 개의 개별 노드 아래에 표시됩니다.
표에는 각 메서드(최상위 노드)에 관한 포괄 시간 및 전용 시간(밀리초 단위)과 총 시간의 백분율이 표시됩니다.
전용 시간은 메서드의 자체 코드를 실행하는 데 소요된 시간이며, 포괄 시간은 메서드의 자체 코드를 실행하는 데 소요된 시간과 하위 요소를 실행하는 데 소요된 시간을 더한 것입니다. 또한 타이밍 정보는 CPU 시간과 실시간으로 보고됩니다. CPU 시간은 스레드가 CPU 시간을 적극적으로 사용하는 시간만 고려하며 실시간은 스레드가 활성 상태인지 아니면 일시정지 중인지에 관계없이 앱이 메서드에 들어오는 순간부터 이 메서드에서 나갈 때까지의 절대 타이밍 정보를 제공합니다.
프로필 창에 있는 각 최상위 노드의 경우 표의 Calls + Rec, Calls/Total 열(그림 2에 표시되지 않음)에 메서드 호출 수와 재귀 호출 수가 보고됩니다. 또는 상위 및 하위 메서드의 경우 이 열에는 메서드가 최상위 노드에 있는 메서드의 상위 또는 하위인 호출의 수가 표시됩니다.
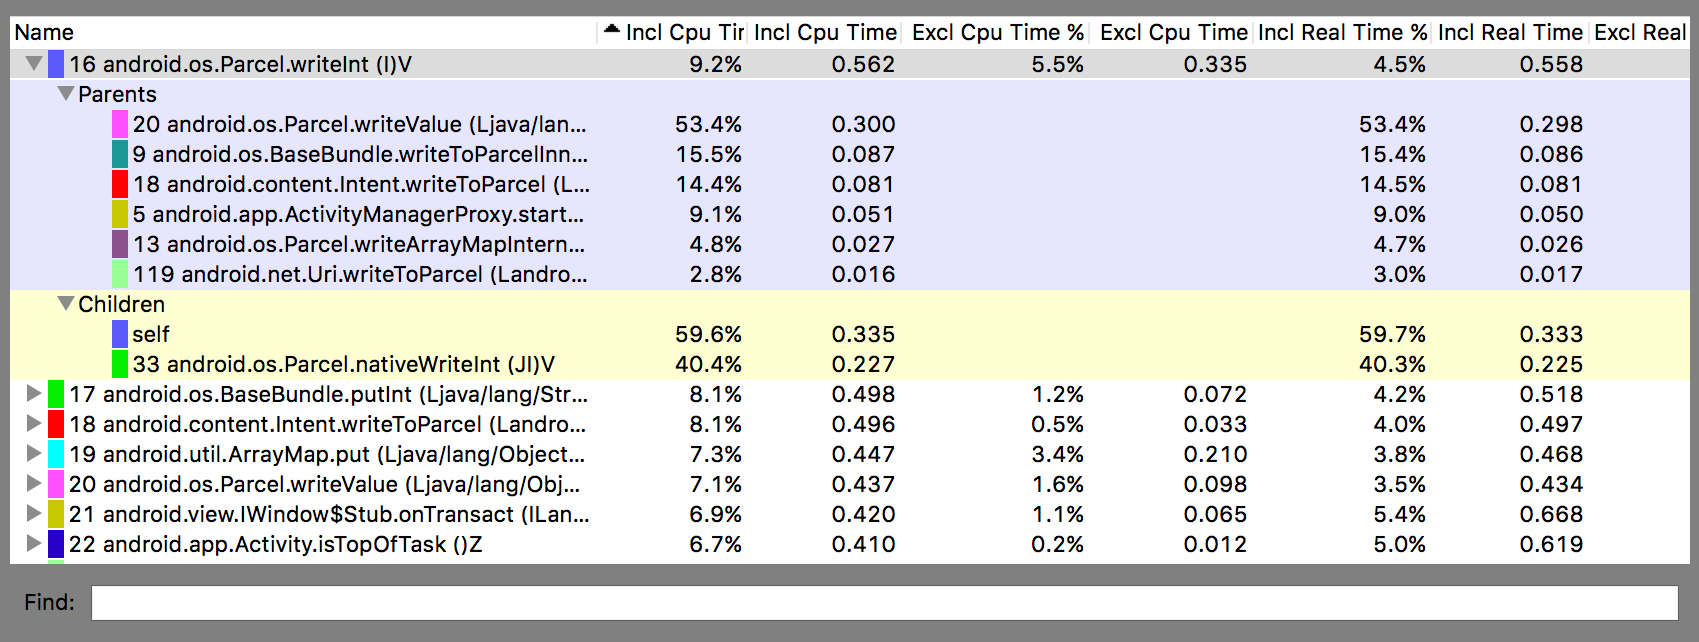
그림 2. Traceview 프로필 창
알려진 Traceview 문제
Traceview 로깅이 스레드를 잘 처리하지 못하여 다음과 같은 문제가 발생합니다.
- 프로파일링 중에 스레드가 종료되면 스레드 이름이 생성되지 않습니다(Android 5.1 이상에서 수정됨).
- VM이 스레드 ID를 재사용합니다. 스레드가 중지되고 다른 스레드가 시작되는 경우 동일한 ID를 받을 수 있습니다.
이 페이지에 나와 있는 콘텐츠와 코드 샘플에는 콘텐츠 라이선스에서 설명하는 라이선스가 적용됩니다. 자바 및 OpenJDK는 Oracle 및 Oracle 계열사의 상표 또는 등록 상표입니다.
최종 업데이트: 2025-07-27(UTC)
[[["이해하기 쉬움","easyToUnderstand","thumb-up"],["문제가 해결됨","solvedMyProblem","thumb-up"],["기타","otherUp","thumb-up"]],[["필요한 정보가 없음","missingTheInformationINeed","thumb-down"],["너무 복잡함/단계 수가 너무 많음","tooComplicatedTooManySteps","thumb-down"],["오래됨","outOfDate","thumb-down"],["번역 문제","translationIssue","thumb-down"],["샘플/코드 문제","samplesCodeIssue","thumb-down"],["기타","otherDown","thumb-down"]],["최종 업데이트: 2025-07-27(UTC)"],[],[],null,["# Inspect trace logs with Traceview\n\n**Traceview is deprecated.** If you're using Android\nStudio 3.2 or later, you should instead use\n[**CPU Profiler**](/studio/profile/cpu-profiler) to inspect\n`.trace` files captured by\n[instrumenting your app](/studio/profile/generate-trace-logs)\nwith the [`Debug`](/reference/android/os/Debug)\nclass, record new method traces, save `.trace` files, and inspect\nreal-time CPU usage of your app's processes.\n\nTraceview is a tool that provides a graphical representations of\ntrace logs. You can generate the logs by instrumenting your code with the\n[`Debug`](/reference/android/os/Debug) class. This method of tracing is\nvery precise because you can specify exactly where in the code you want to start\nand stop logging trace data. If you haven't yet generated these trace logs and\nsaved them from your connected device to your local machine, go to [Generate\ntrace logs by instrumenting your app](/studio/profile/generate-trace-logs).\nInspecting these logs using Traceview helps you debug your app and\nprofile its performance.\n\n\n**Tip:** You can [use\n`dmtracedump`](/studio/command-line/dmtracedump) from the command-line to generate a graphical\ncall-stack diagrams of your trace log files.\n\nIf you don't need to view trace logs that you have recorded by instrumenting\nyour app with the [Debug](/reference/android/os/Debug)\nclass, you can [use the CPU profiler](/studio/profile/cpu-profiler)\nincluded in Android Studio 3.0 and higher to inspect your app's threads and record\nmethod traces.\n\nOpen a trace log using Traceview\n--------------------------------\n\nTo open a trace log with Traceview from Android Studio, proceed as follows:\n\n1. Start [Android Device Monitor](/studio/profile/monitor).\n2. In the Android Device Monitor, select **File \\\u003e Open File**.\n3. Navigate to the `.trace` file you want to inspect.\n4. Click **Open**.\n\n\u003cbr /\u003e\n\n**Note:** If you are trying to view the trace logs\nof an app that is built with code shrinking enabled (such as a release build),\nsome method and member names might be obfuscated. You can use the ProGuard\n`mapping.txt` file to figure out the original unobfuscated names.\nFor more information on this file, see\n[Decode an obfuscated\nstack trace](/studio/build/shrink-code#decode-stack-trace).\n\n**Note:** Running `traceview` from the\ncommand line has been deprecated.\n\nTraceview overview\n------------------\n\nAfter opening a trace log, Traceview displays log data using the following two\npanes:\n\n- A [timeline pane](#timeline_pane) that describes when each thread enters and exits a method\n- A [profile pane](#profile_pane) that summarizes the execution of each thread over the period of the trace log\n\nThe sections below provide addition information about the traceview output panes.\n\n### Timeline pane\n\nFigure 1 shows a close up of the timeline pane. Each thread's execution is\nshown in its own row, with the elapsed time increasing towards the right.\nEach method is shown in varying colors. The thin lines underneath the first\nrow show the children (from entry to exit) of the selected method.\n\n\n**Figure 1.**\nThe Traceview timeline pane.\n\n\u003cbr /\u003e\n\n### Profile pane\n\nAs shown in figure 2, the profile pane provides a list of each method the system\nexecuted over the period of the trace log and the time spent executing those\nmethods. A method that calls another method is referred to as the *parent* , and\nmethods that a parent calls are referred to as its *children*. When you\nselect a method by clicking on it, it displays both its parents and its children\nunder two separate nodes.\n\nFor each method (top-level node), the table shows both its inclusive and\nexclusive times (in milliseconds) as well as the percentage of the total time.\n*Exclusive time* is the time spent executing the method's own code, while\n*inclusive time* is the time spent executing the method's own code plus the time\nspent executing its children. Timing information is also reported in terms of\nCPU time and real time. *CPU time* considers only the time that the thread is\nactively using CPU time, and *real time* provides absolute timing information\nfrom the moment your app enters a method to when it exits that method---regardless\nof whether the thread is active or sleeping.\n\nFor each top-level node in the profile pane, the **Calls + Rec, Calls/Total**\ncolumn in the table (not shown in figure 2) reports the number of calls to the\nmethod and the number of recursive calls. Or, for parent and child methods, this\ncolumn shows the number of calls in which the method was a child or parent of\nthe method in the top-level node.\n\n\n**Figure 2.** The Traceview profile pane.\n\n\u003cbr /\u003e\n\nTraceview known issues\n----------------------\n\nTraceview logging does not handle threads well, resulting in the following\nissues:\n\n- If a thread exits during profiling, the thread name is not emitted (fixed in Android 5.1 and later);\n- The VM reuses thread IDs. If a thread stops and another starts, they may get the same ID."]]