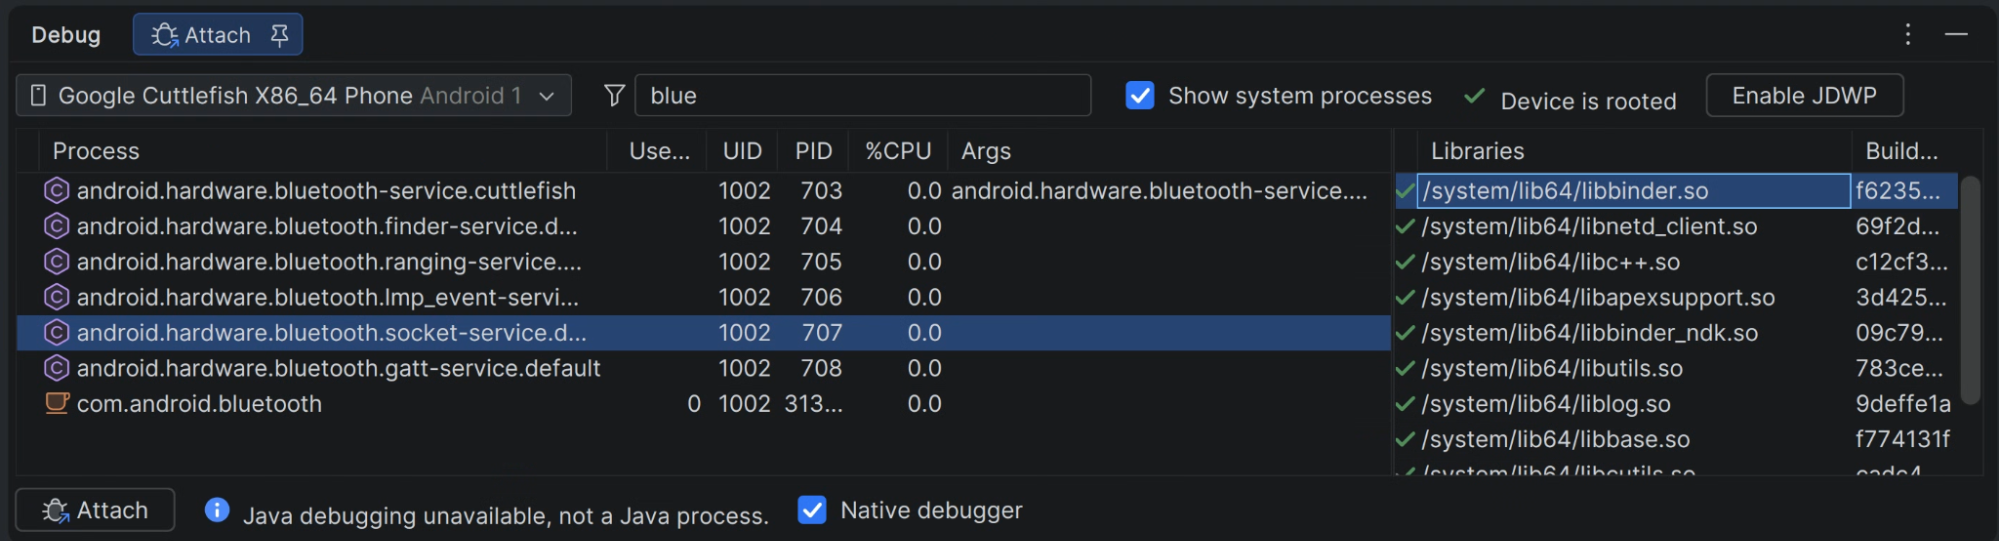
Android Studio for Platform (ASfP) integrates multi-language platform debugging around the Attach tab in the Debug tool window:
- Select Run > Attach to Android Process (Control+Alt+A) to attach the Java debugger, Native debugger (bundled LLDB), or both to any running app or system process on a physical device or Cuttlefish virtual device.
- Inspect every loaded shared library (
.so) and its eight-character ELF Build ID in the Libraries panel before attaching—with checkmark icons verifying matching local debug symbols underout/target/product/<device>/symbols. - Manage device prerequisites from the toolbar: filter with Show system
processes, click Root Device to run
adb root(displaying Device is rooted when active), and click Enable JDWP to enable JDWP onuserdebugbuilds. - Set conditional and exception breakpoints, view inline variable values in the editor, use Drop Frame and smart Step Into, and inspect structured C++ and Rust types at runtime.
Before using the debugger, build your lunch target so the local
out/target/product/<device>/symbols/.build-id symbol index exists, and flash
or launch a matching device image.
Java and dual Java and native debugging
To debug a Java or Kotlin application, system app (such as
com.android.messaging, Settings, or SystemUI), or a process calling into JNI
and C++ or Rust code, complete the following steps:
- Set breakpoints in your Java, Kotlin, C, C++, or Rust source files.
- Select Run > Attach to Android Process (Control+Alt+A). ASfP opens a pinned Attach tab inside the Debug tool window.
- Select your target device from the device drop-down menu. If JDWP isn't
enabled on a
userdebugbuild, click Enable JDWP—ASfP setspersist.debug.dalvik.vm.jdwp.enabled=1and reboots the device. When active, the button displays JDWP enabled with a right-click Disable JDWP action. - Select the target process from the table (Java and ART processes display a coffee-cup icon).
- At the bottom of the Attach tab, select Java debugger, Native
debugger, or both. Selecting both opens two linked tabs in the Debug
tool window:
<process> (<pid>)for built-in LLDB and<process> (<pid>)-jdwpfor Java. Their lifecycles are tied together, so stopping either session stops both. - Click Attach and interact with the app on your device to hit your breakpoints.

System process (C and C++) debugging and symbol verification
To debug system daemons, HALs, or system services (such as
android.hardware.bluetooth-service.cuttlefish, surfaceflinger, or
audioserver), complete the following steps:
- Open Run > Attach to Android Process (Control+Alt+A). If the toolbar
shows Root Device, click it so ASfP runs
adb rootand displays Device is rooted. - Select Show system processes in the top toolbar and filter for your target process.
- Verify local debug symbols in the Libraries panel: Selecting a process
populates the Libraries table with every ELF shared library (
.so) loaded in the process and the first eight hexadecimal characters of its ELF Build ID. ASfP matches each Build ID againstout/target/product/<device>/symbols(symbols/.build-idis required to resolve libraries inside APEXes):- Verified libraries display a checkmark icon. Point to any resolved row
to preview its full local
.debugsymbol path. - Unresolved libraries without matching local symbols display a warning icon.
- Verified libraries display a checkmark icon. Point to any resolved row
to preview its full local
- Non-Java process detection: When you select a C++ or Rust process
(marked with a hexagon
Cicon), ASfP hides Java debugger and displays Java debugging unavailable, not a Java process. while keeping Native debugger checked. - Set breakpoints in your C, C++, or Rust source files, click Attach, and trigger the code path on the device.
Debug Rust code
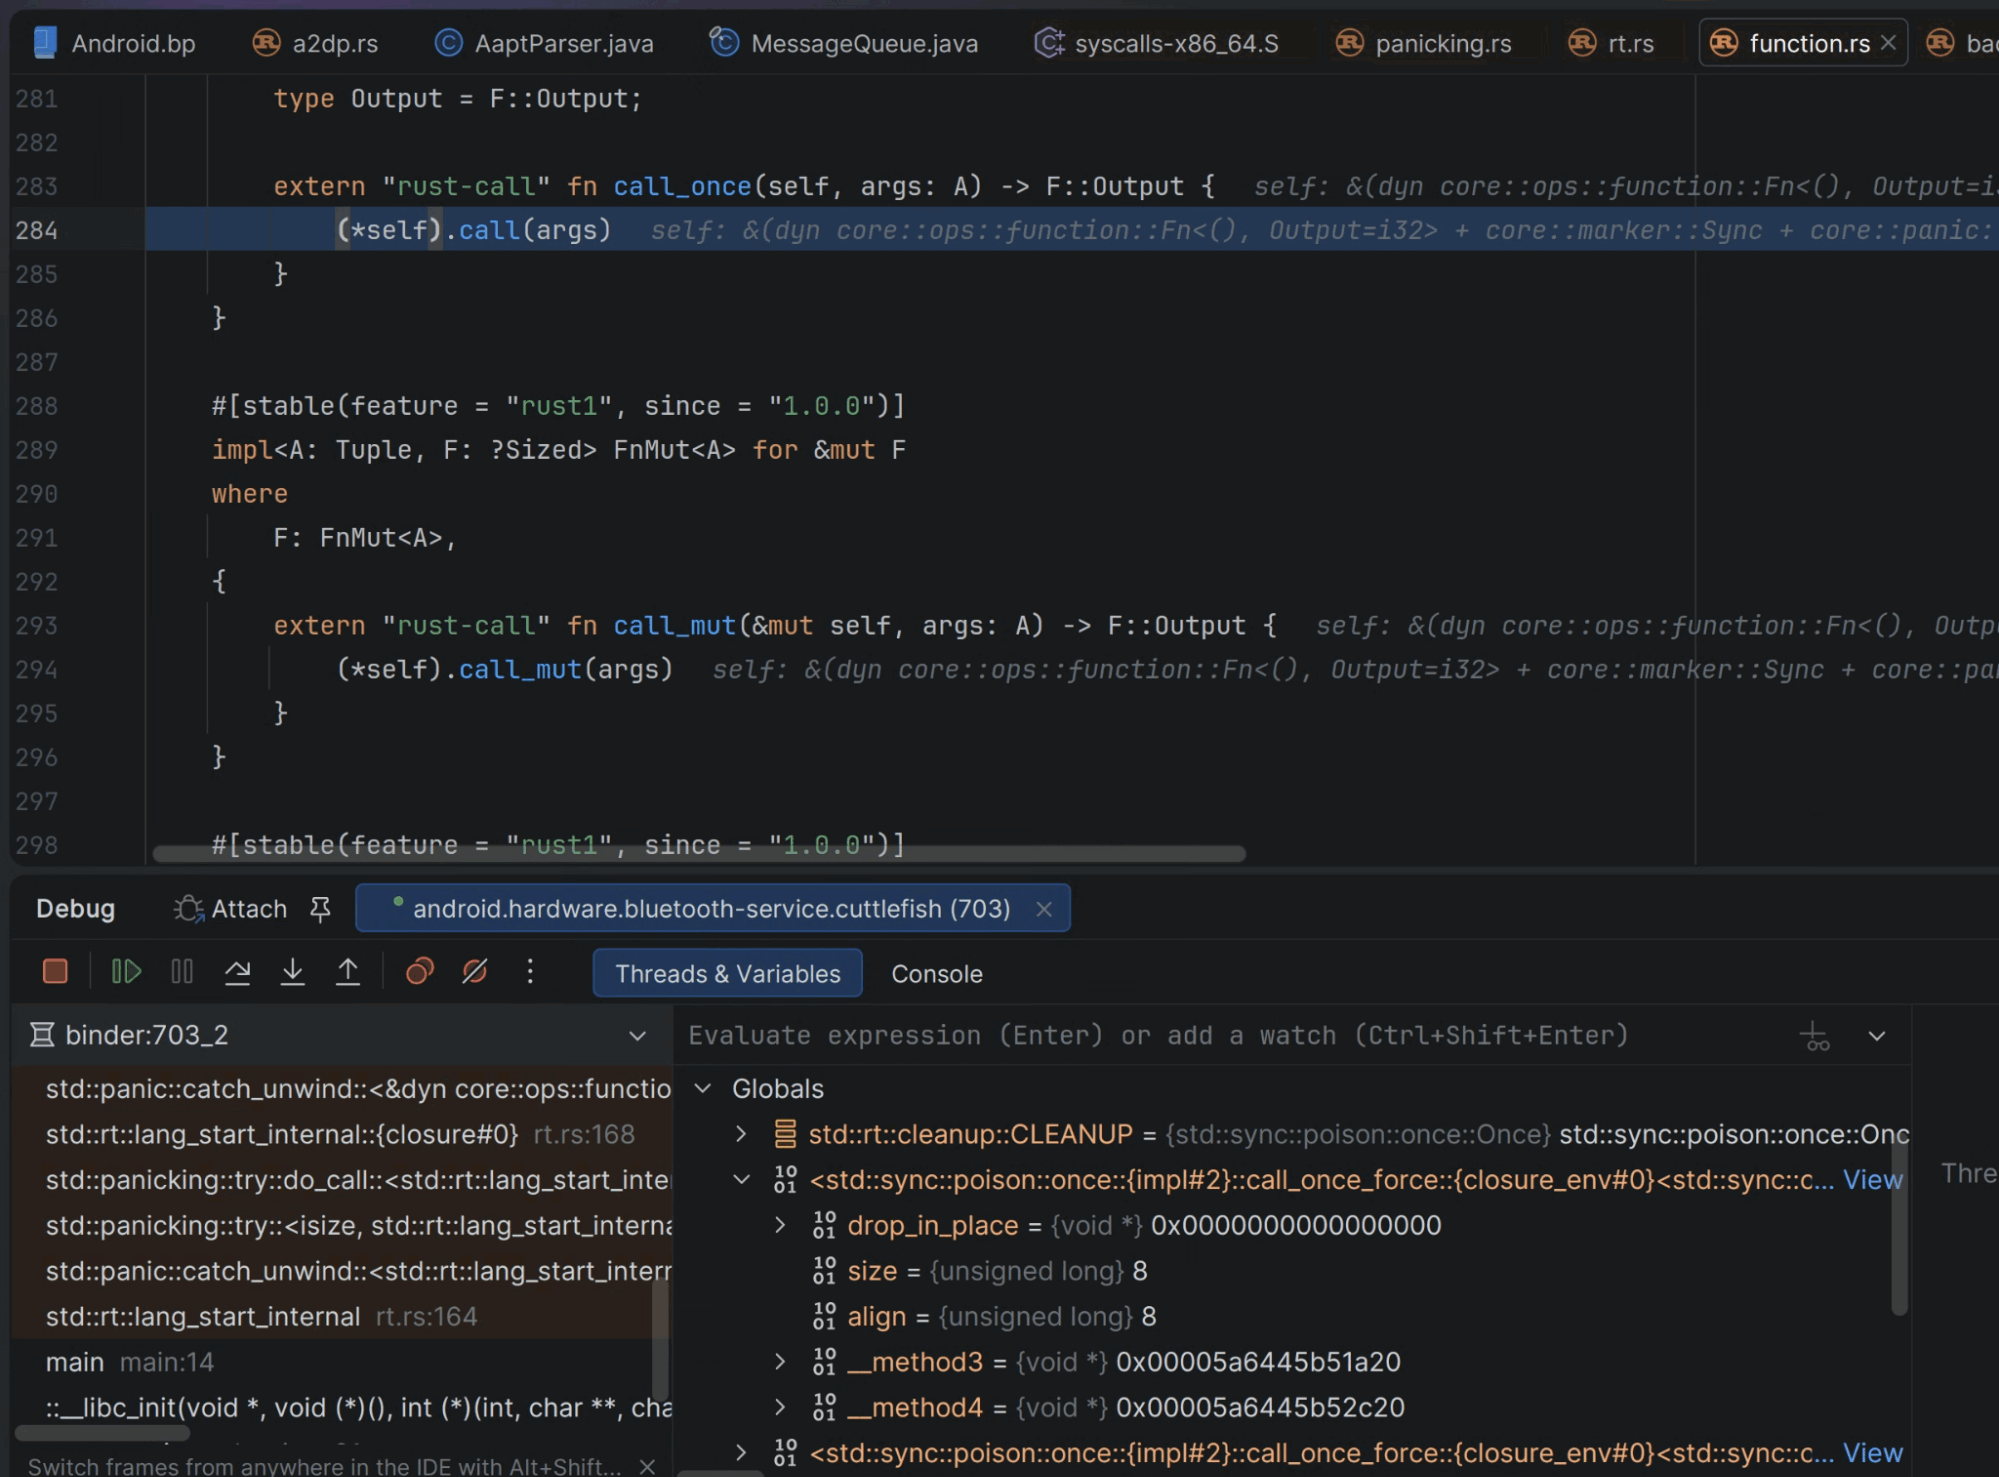
ASfP debugs Rust platform code with the same built-in LLDB debugger used for C
and C++. No external adapter or manual server setup is required: ASfP uses
lldb-dap from its bundled toolchain and automatically loads the Rust
pretty-printers from your AOSP prebuilts so standard types like String, Vec,
HashMap, and Option display structured values in the Variables pane.
Attach to a running Rust process on a device
Follow the steps in System process (C and C++) debugging: open Run > Attach to Android Process, verify Device is rooted and local symbols show a checkmark in the Libraries panel, keep Native debugger checked, and click Attach. Rust and C or C++ stack frames appear together in the same debug session.
Debug a rust_test or rust_test_host module
- Open the
Android.bpfile declaring arust_testorrust_test_hosttarget and click the Run icon in the gutter next to the module type. - Select Debug '<ModuleName>'. ASfP builds the target, launches the test binary under LLDB on your host machine or connected device, and pauses at your Rust breakpoints.
- To debug a single test function or customize LLDB startup commands, open Run > Edit Configurations, select the generated Soong Test configuration, and set Method or expand the Debugger options. For more information about Soong Test configuration options, see Test platform code with atest.