
Android Studio is the official Integrated Development Environment (IDE) for Android app development. Based on the powerful code editor and developer tools from IntelliJ IDEA, Android Studio offers even more features that enhance your productivity when building Android apps, such as:
- A flexible Gradle-based build system
- A fast and feature-rich emulator
- A unified environment where you can develop for all Android devices
- Live Edit to update composables in emulators and physical devices in real time
- Code templates and GitHub integration to help you build common app features and import sample code
- Extensive testing tools and frameworks
- Lint tools to catch performance, usability, version compatibility, and other problems
- C++ and NDK support
This page provides an introduction to basic Android Studio features. For a summary of the latest changes, see the Android Studio release notes.
Project structure
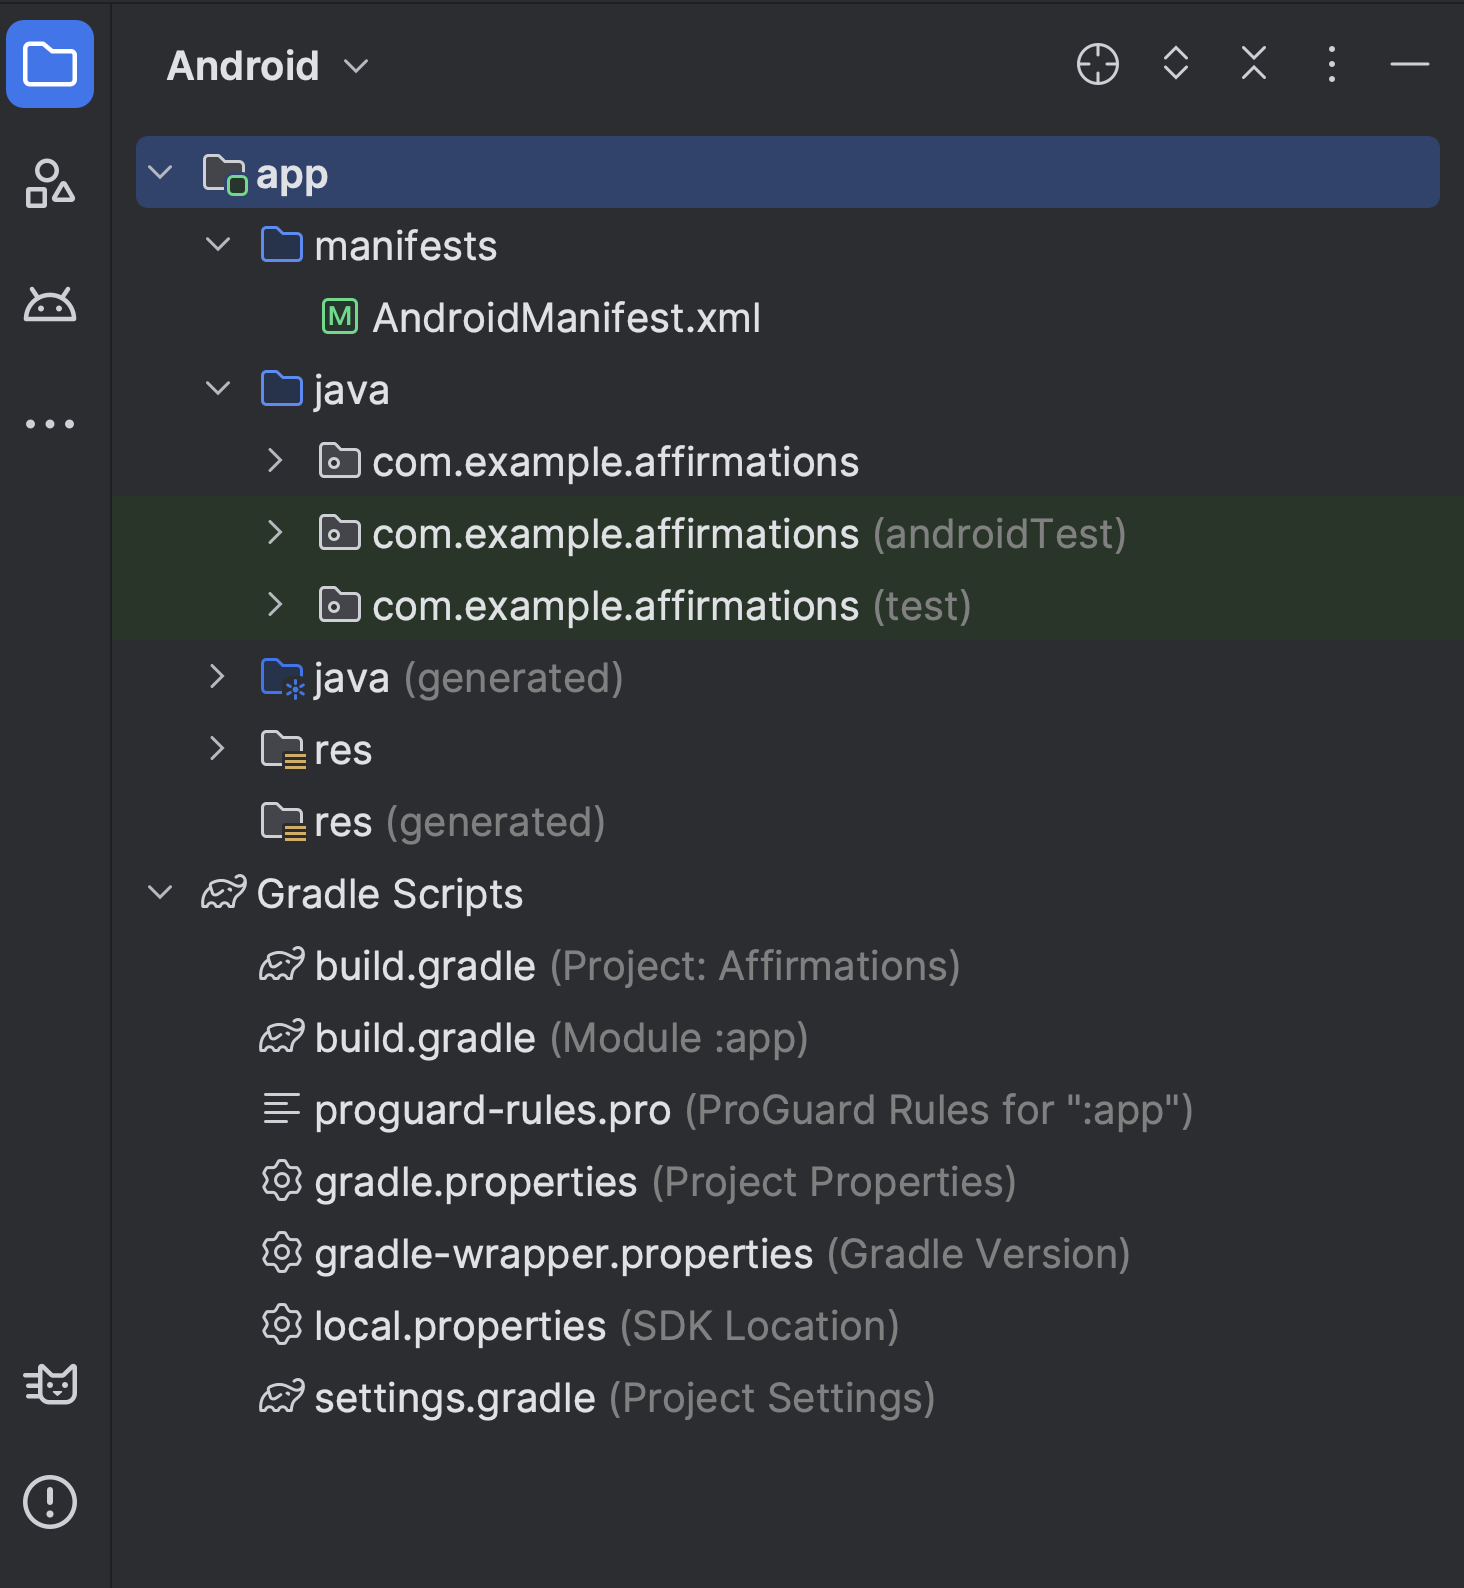
Figure 1. Project files in Android view.
Each project in Android Studio contains one or more modules with source code files and resource files. The types of modules include:
- Android app modules
- Library modules
- Google App Engine modules
By default, Android Studio displays your project files in the Android view, as shown in figure 1. This view is organized by modules to provide quick access to your project's key source files. All the build files are visible at the top level, under Gradle Scripts.
Each app module contains the following folders:
- manifests: Contains the
AndroidManifest.xmlfile. - kotlin+java: Contains the Kotlin and Java source code files, including JUnit test code.
- res: Contains all non-code resources such as UI strings and images.
The Android project structure on disk differs from this flattened representation. To see the actual file structure of the project, select Project instead of Android from the Project menu.
For more information, see Projects overview.
Gradle build system
Android Studio uses Gradle as the foundation of the build system, with more Android-specific capabilities provided by the Android Gradle plugin. This build system runs as an integrated tool from the Android Studio menu and independently from the command line. You can use the features of the build system to do the following:
- Customize, configure, and extend the build process.
- Create multiple APKs for your app with different features, using the same project and modules.
- Reuse code and resources across source sets.
By employing the flexibility of Gradle, you can achieve all of this without modifying your app's core source files.
Android Studio build files are named build.gradle.kts if you use
Kotlin (recommended) or build.gradle if
you use Groovy. They are plain text files
that use the Kotlin or Groovy syntax to configure the build with elements
provided by the Android Gradle plugin. Each project has one top-level build file
for the entire project and separate module-level build files for each module.
When you import an existing project, Android Studio automatically generates the
necessary build files.
To learn more about the build system and how to configure your build, see Configure your build.
Build variants
The build system can help you create different versions of the same app from a single project. This is useful when you have both a free version and a paid version of your app or if you want to distribute multiple APKs for different device configurations on Google Play.
For more information about configuring build variants, see Configure build variants.
Resource shrinking
Resource shrinking in Android Studio automatically removes unused resources from your packaged app and library dependencies. For example, if you add an image or string to your project but never actually reference it in your UI, resource shrinking safely removes that asset from your packaged app.
For more information on shrinking code and resources, see Enable app optimization with R8.
Manage dependencies
Dependencies for your project are specified by name in the module-level build
script. Gradle finds dependencies and makes them available in your build. You
can declare module dependencies, remote binary dependencies, and local binary
dependencies in your build.gradle.kts file.
Android Studio configures projects to use the Maven Central Repository by default. This configuration is included in the top-level build file for the project.
For more information about configuring dependencies, read Add build dependencies.
Debug and profile tools
Android Studio helps you debug and improve the performance of your code, including inline debugging and performance analysis tools.
Inline debugging
Use inline debugging to enhance your code walkthroughs in the debugger view with inline verification of references, expressions, and variable values.
Inline debug information includes:
- Inline variable values
- Objects that reference a selected object
- Method return values
- Lambda and operator expressions
- Tooltip values
To enable inline debugging, in the Debug window, click Settings
![]() and select Show Variable Values in Editor.
and select Show Variable Values in Editor.
Layout Inspector
Layout Inspector lets you inspect a Compose layout inside a running app in an emulator or physical device. You can use the Layout Inspector to check how often a composable is recomposed or skipped, which can help identify issues with your app.
To start the Layout Inspector, run your app, go to the
Running Devices window, and click Toggle Layout Inspector
 .
If you switch among multiple devices or projects, the Layout Inspector
automatically connects to the debuggable processes running in the foreground of
the connected device.
.
If you switch among multiple devices or projects, the Layout Inspector
automatically connects to the debuggable processes running in the foreground of
the connected device.
For more information, see Layout Inspector.
Performance profilers
Android Studio provides performance profilers so you can easily track your app's memory and CPU usage, find deallocated objects, locate memory leaks, optimize graphics performance, and analyze network requests.
To use performance profilers, with your app running on a device or emulator, open the Android Profiler by selecting View > Tool Windows > Profiler.
For more information about performance profilers, see Profile your app performance.
Heap dump
When profiling memory usage in Android Studio, you can simultaneously
initiate garbage collection and dump the Java heap to a heap snapshot in an
Android-specific HPROF binary format file. The HPROF viewer displays classes,
instances of each class, and a reference tree to help you track memory usage
and find memory leaks.
For more information about working with heap dumps, see Capture a heap dump.
Memory Profiler
Use Memory Profiler to track memory allocation and watch where objects are being allocated when you perform certain actions. These allocations help you optimize your app's performance and memory use by adjusting the method calls related to those actions.
For information about tracking and analyzing allocations, see Heap dump overview.
Data file access
The Android SDK tools, such as Systrace and Logcat, generate performance and debugging data for detailed app analysis.
To view the available generated data files:
- Open the Android Profile and select Past Recordings.
- In the list of the generated files, double-click a file to view the data.
- Right-click any HPROF files to convert them to the standard.
- Investigate your RAM usage file format.
Code inspections
Whenever you compile your program, Android Studio automatically runs configured lint checks and other IDE inspections to help you easily identify and correct problems with the structural quality of your code.
The lint tool checks your Android project source files for potential bugs and optimization improvements for correctness, security, performance, usability, accessibility, and internationalization.
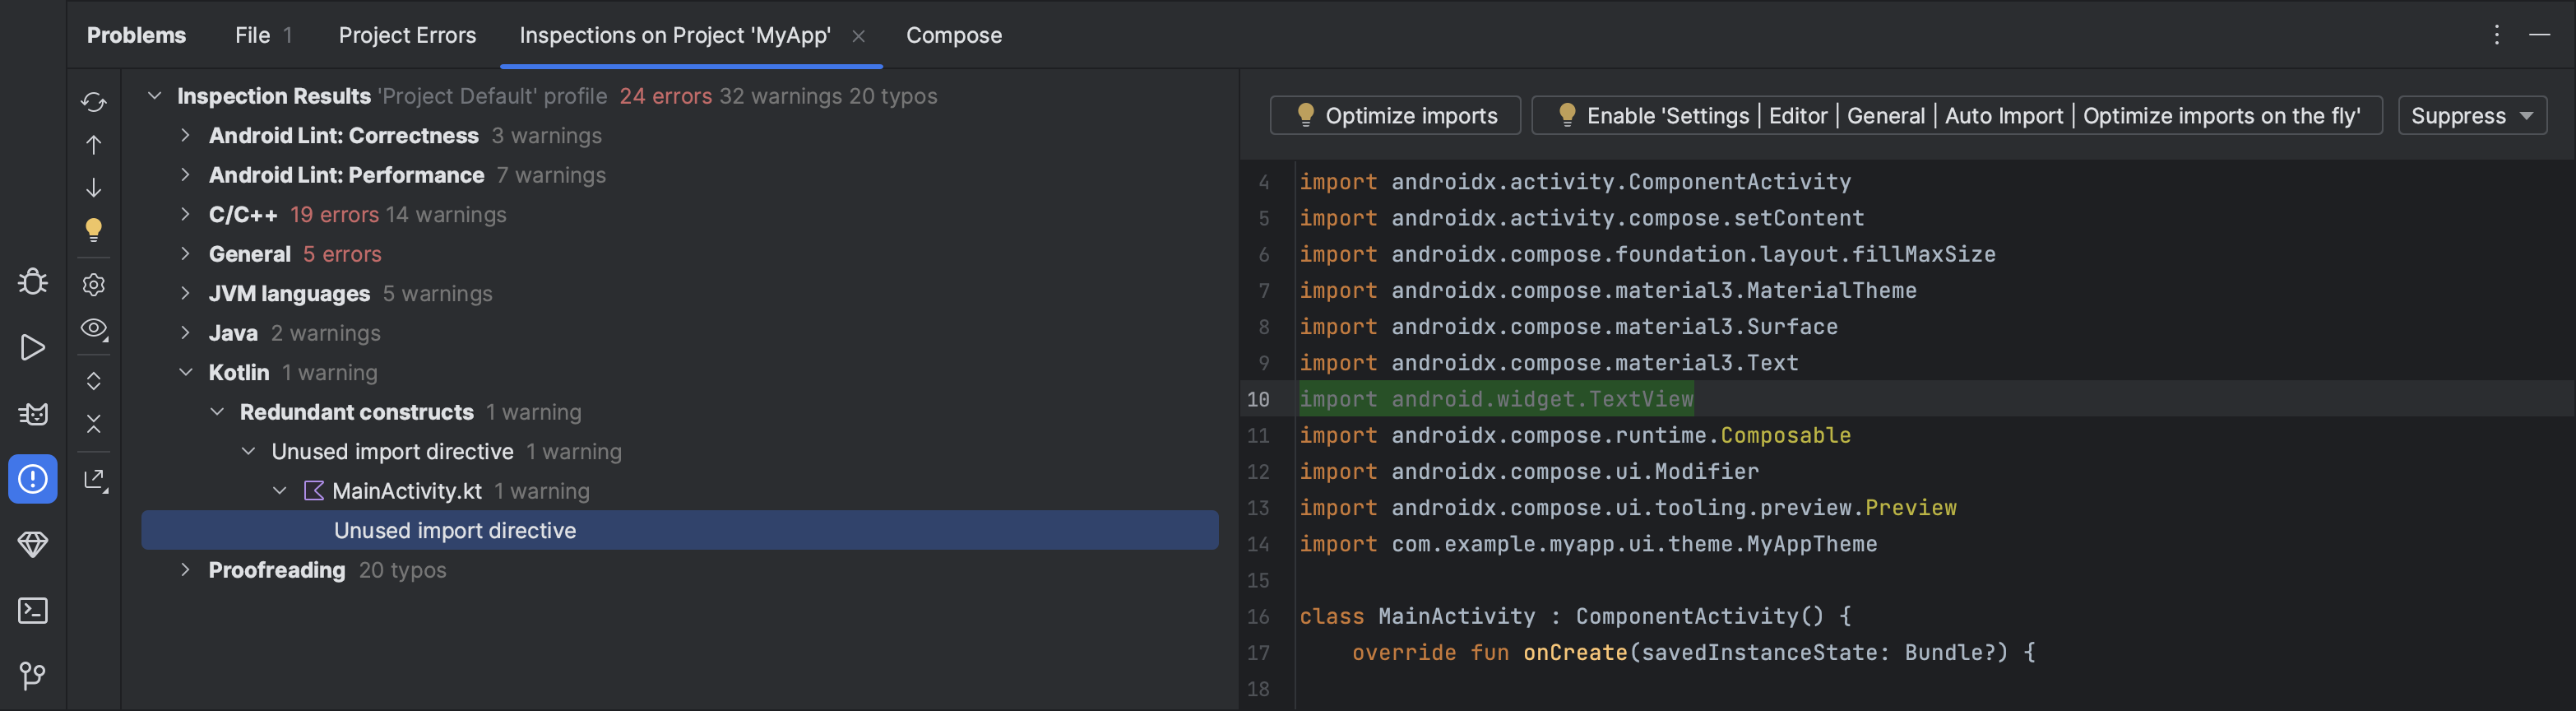
Figure 2. The results of a lint inspection in Android Studio.
In addition to lint checks, Android Studio performs IntelliJ code inspections and validates annotations to streamline your coding workflow.
For more information, see Improve your code with lint checks.
Annotations in Android Studio
Android Studio supports annotations for variables, parameters, and return values to help you catch bugs, such as null pointer exceptions and resource type conflicts.
The Android SDK Manager packages the Jetpack Annotations library in the Android Support Repository for use with Android Studio. Android Studio validates the configured annotations during code inspection.
For more details about Android annotations, see Improve code inspection with annotations.
Log messages
When you build and run your app with Android Studio, you can view
adb output and device log messages
in the Logcat window.
Sign in to your developer account
Sign in to your developer account in Android Studio to access additional tools that require authentication, such as Firebase and Android Vitals in App Quality Insights and Gemini in Android Studio. By signing in, you give those tools permission to view and manage your data across Google services.
To sign in to your developer account in Android Studio, click the profile icon
![]() at
the end of the toolbar. Follow the prompts to provide the IDE with only the
permissions required for each feature you want to enable. If you're already
signed in, manage the permissions at File (Android Studio on macOS) >
Settings > Tools > Google Accounts.
at
the end of the toolbar. Follow the prompts to provide the IDE with only the
permissions required for each feature you want to enable. If you're already
signed in, manage the permissions at File (Android Studio on macOS) >
Settings > Tools > Google Accounts.