
Hierarchy Viewer is deprecated. If you're using Android Studio 3.1 or later, you should instead use Layout Inspector to inspect your app's view hierarchy at runtime. To profile the rendering speed of your app's layout, use Window.OnFrameMetricsAvailableListener as described in this blog post.
Hierarchy Viewer is a tool built into Android Device Monitor that allows you to measure the layout speed for each view in your layout hierarchy. It can help you find performance bottlenecks caused by the structure of your view hierarchy.
Note: Hierarchy Viewer is no longer being developed. To inspect the properties in your view hierarchy at runtime, you should instead use Layout Inspector in Android Studio. However, Layout Inspector does not currently provide profiling details about your layout performance.
This page provides an introduction to Hierarchy Viewer and a walkthrough for profiling your layout.
Get set up
If you're using the Android Emulator, you can skip this section. Otherwise, you need to set up your device as follows.
Note: Your device must be running Android 4.1 or higher.
- Enable Developer Options on your device.
- Set the environment variable
ANDROID_HVPROTO=ddmon your development machine.This variable tells Hierarchy Viewer to connect to the device using the
ddmprotocol, which is the same as the DDMS protocol. The caveat is that there can be only one process on the host that connects to the device, so you must kill any other DDMS session to run Hierarchy Viewer.
Start Hierarchy Viewer
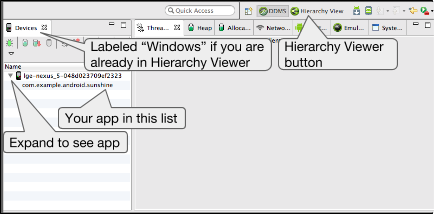
Figure 1. Android Device Monitor
- Connect your device to your computer. If prompted by a dialog on the device that asks, Allow USB debugging?, tap OK.
- Open your project in Android Studio, build and run it on your device.
- Start Android Device Monitor.
Android Studio might show a Disable adb integration dialog because only one process can
connect to the device via adb at once, and Android Device Monitor is requesting a connection.
So click Yes.
Figure 1 illustrates what initially appears in the Android Device Monitor.
- In the menu bar, select Window > Open
Perspective, and then click Hierarchy View.
You should see an arrangement similar to what's shown in figure 2. If not, select Window > Reset Perspective to return to the default layout.
- Double-click your app's package name in the Windows tab on the left. This populates the panes with the view hierarchy of your app.
Get familiar with the tools
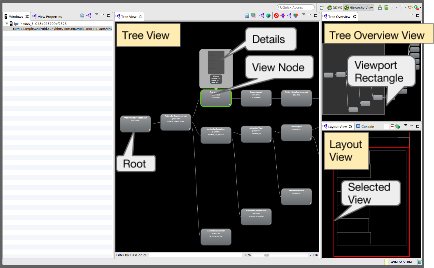
Figure 2. Hierarchy Viewer panes.
The Hierarchy Viewer provides the following panes (as shown in figure 2):
- Tree View (center): Shows a tree view of your view hierarchy.
You can drag and zoom the tree using your mouse and the zoom control at the bottom.
Each node indicates it's
Viewclass name and ID name. - Tree Overview (top right): Gives you a bird's-eye view of your app's complete view hierarchy. Move the grey rectangle to change the viewport that's visible in the Tree View.
- Layout View (bottom right): Shows a wireframe view of your layout.
The outline of the currently selected view is red, and its parent view is light red.
Clicking a view here also selects it in the Tree View, and vice versa.
The view hierarchy is a snapshot of the layout, so it does not automatically update.
To update the hierarchy view, click Reload the view hierarchy
 .
.
To invalidate a view (request that the system call onDraw()
during the next layout update), select a view in the hierarchy and
then click Invalidate the layout  (this is equivalent to calling
 invalidate() on the view).
And to request the view (and any children) actually lay out, click Request lay out
 .
.
If you navigate to a different app, you must select that app from the Windows tab in the left pane to view its view hierarchy.
To view details about the view including its measure, layout, and draw times (as shown in figure 3), click the view in the Tree View. Double-click on the view to see an enlarged image of it.
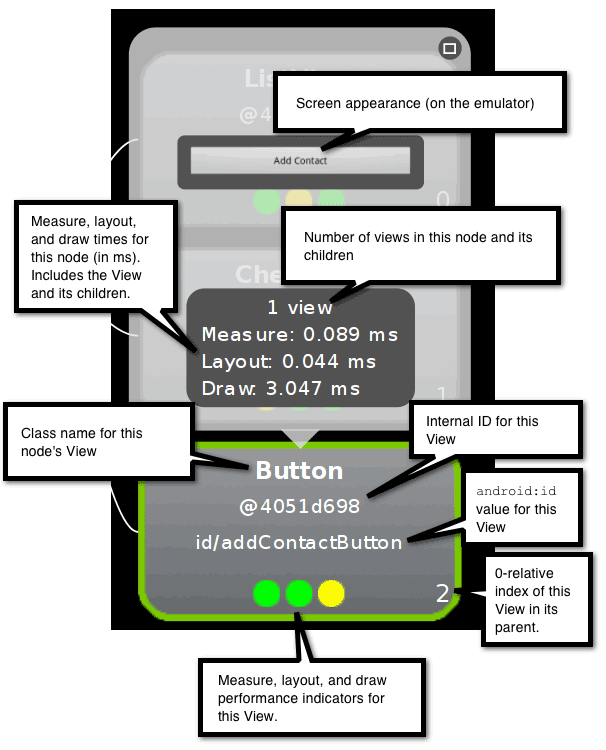
Figure 3. Parts of the view node display.
To see the view's properties, click the View Properties tab in the left pane, as shown in figure 4.
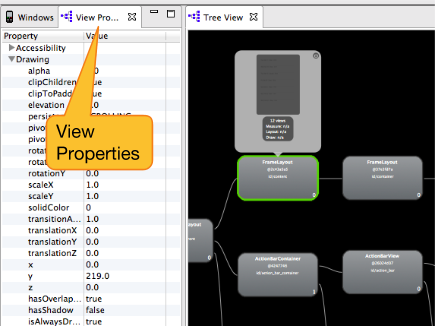
Figure 4. Location of the View Properties tab.
To save a layered screenshot of your layout to an Adobe Photoshop (PSD) file, click
Capture the window layers  in the toolbar. Each view is saved as its own layer so you
can easily create a new mock by hiding and adjusting each view.
in the toolbar. Each view is saved as its own layer so you
can easily create a new mock by hiding and adjusting each view.
Profile your layout
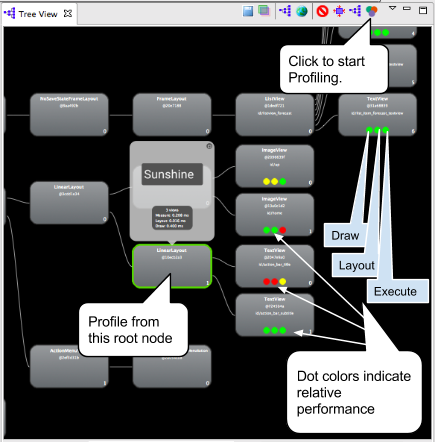
Figure 5. View hierarchy after profiling.
Now that you know your way around the tool, you can use it to profile your view hiearchy and interpret the results.
- In the Tree View or the Layout View, click on the view node whose children you want to profile.
- To start profiling, click Obtain layout times
 at the top of the Tree View.
For large view hierarchies, profiling may take a few seconds.
Each child view of your selected node gets three dots, which can be green, yellow, or red.
- The left dot represents the draw process of the rendering pipeline.
- The middle dot represents the layout phase.
- The right dot represents the execute phase.
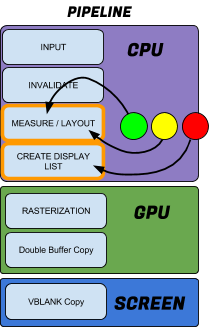
Figure 6. How the colored dots relate
to the rendering pipeline.
These dots roughly correspond to the measure, layout, and draw phases of the processing pipeline. The color of the dots indicates the relative performance of this node in respect to all other profiled nodes in the local family.
- Green means the view renders faster than at least half of the other views.
- Yellow means the view renders faster than the bottom half of the other views.
- Red means the view is among the slowest half of views.
Interpreting the results
Hierarchy Viewer measures the performance of each node relative to sibling views, so there are always red nodes in a profile—unless all views performed identically—and it doesn't necessarily mean that the red one is performing poorly (only that it's the slowest view in the local view group).
Hierarchy Viewer rasterizes your layout to acquire the timing information. Rasterization is the process of taking a high-level primitive, such as a circle or a vector font, and turning it into pixels on the screen. Typically, rasterization is done by the GPU on your device, but in the case of software rasterization, rendering is done on the CPU with ordinary software. This means that the absolute reported timings are correct relative to each other, but are bloated and vary depending on the overall and changing CPU workload on your device and your development machine. So it does not reflect real-world performance speeds on a device and you should profile multiple times to get a sense for the average measurements.
A red node is a potential problem in any situation where your app has unexpectedly slow performance. In a relative setting, there is always a slowest node; just make sure it is the node you expect. The following examples illustrate how to interpret red dots.
- Look for red dots in leaf nodes or view groups with only a few children. This might point to a problem. Your app may not be slow, or it may not be slow on your device, but you need to be aware of why that dot is red. Systrace or Traceview can give you additional information.
- If you have a view group with many children and a red measure phase, take a look at the children to see how they are performing.
- A view with yellow or even red dots might not be performing slowly on the device. That's where the actual numbers are helpful. Systrace or Traceview can give you additional information.
- If the root view of a hierarchy has a red measure phase, red layout phase, and yellow draw phase, this is somewhat typical, because it's the parent of all the other views and its layout isn't finished until the children finish.
- If a leaf node in a tree with 20+ views has a red draw phase, this is a
problem. Check your
onDraw()method for code that shouldn't be there.
For more layout tips, see Improving Layout Performance.