
In addition to building tests to make sure your app meets its functional requirements, it's important that you also run the code through the lint tool to help ensure your code has no structural problems. The lint tool helps find poorly structured code that can impact the reliability and efficiency of your Android apps and make your code harder to maintain. It is strongly recommended that you correct any errors that lint detects before publishing your app.
For example, if your XML resource files contain unused namespaces, this takes up space and requires unnecessary processing. Other structural issues, such as use of deprecated elements or API calls that are not supported by the target API versions, might lead to code failing to run correctly. Lint can help you clean up these issues.
To improve linting performance, you can also add annotations to your code.
Overview
Android Studio provides a code scanning tool called lint that can help you identify and correct problems with the structural quality of your code without having to execute the app or write test cases. Each problem detected by the tool is reported with a description message and a severity level so that you can prioritize the critical improvements that need to be made. You can also lower the severity level of a problem to ignore issues that are not relevant to your project or raise the severity level to highlight specific problems.
The lint tool checks your Android project source files for potential bugs and optimization improvements for correctness, security, performance, usability, accessibility, and internationalization. When using Android Studio, configured lint and IDE inspections run when you build your app. However, you can run inspections manually or run lint from the command line, as described on this page.
The built-in lint tool checks your code while you're using Android Studio. You can view warnings and errors in two ways:
- As pop-up text in the editor window. When lint finds a problem, it highlights the problematic code in yellow. For more serious issues, it underlines the code in red.
- In the lint Inspection Results window when you click Code > Inspect Code.
Note: When your code is compiled in Android Studio, additional IntelliJ code inspections run to streamline code review. Keep Android Studio as up-to-date as possible to ensure the latest lint rules and inspections are available.
Figure 1 shows how the lint tool processes app source files.
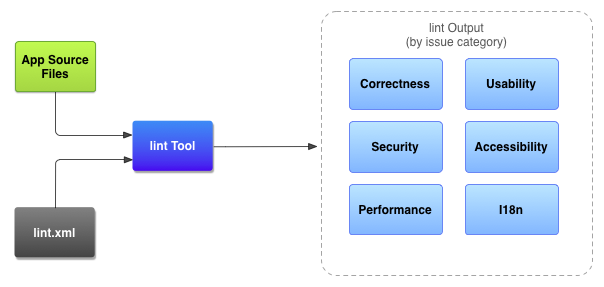
- App source files
- The source files consist of files that make up your Android project, including Kotlin and XML files, icons, and ProGuard configuration files.
- The
lint.xmlfile - A configuration file that you can use to specify any lint checks that you want to exclude and to customize problem severity levels.
- The lint tool
- A static code scanning tool that you can run on your Android project either from the command line or in Android Studio. The lint tool checks for structural code problems that could affect the quality and performance of your Android app.
- Results of lint checking
- You can view the results from lint either in the console or the Inspection Results
window in Android Studio. If you run
lintfrom the command line, the results are written to thebuild/folder. For further details, see the section about running inspections manually.
Run lint from the command line
If you're using Android Studio or Gradle, use the Gradle wrapper to invoke the lint task for your project by
entering one of the following commands from the root directory of your project:
Note: Keep the Android Gradle plugin as up-to-date as possible to use the latest lint rules.
- On Windows:
gradlew lint
- On Linux or macOS:
./gradlew lint
You should see output similar to the following:
> Task :app:lintDebug
Wrote HTML report to file:<path-to-project>/app/build/reports/lint-results-debug.html
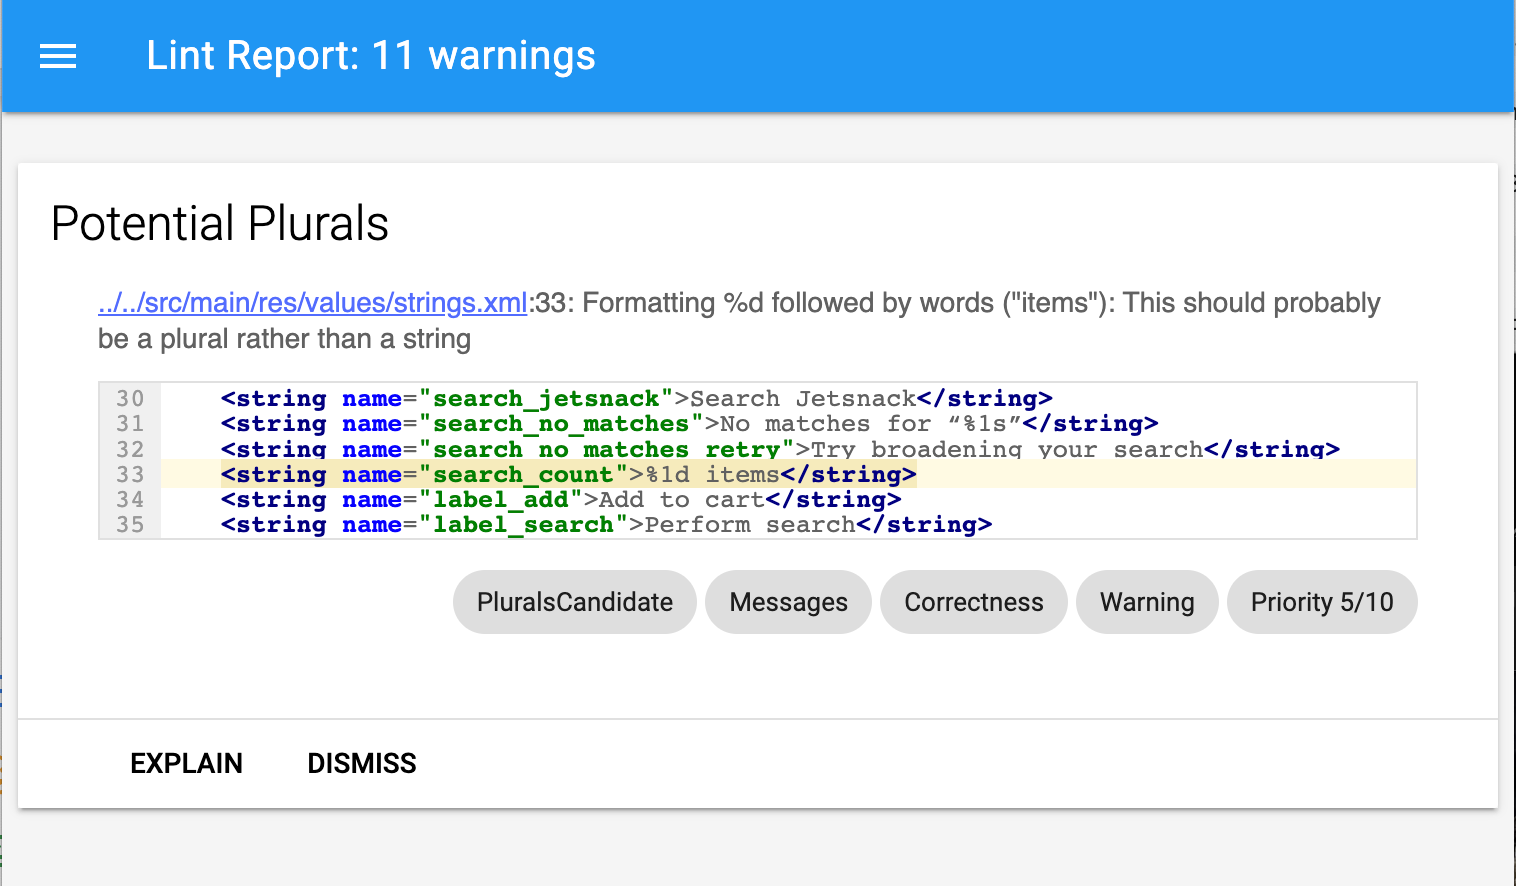
When the lint tool completes its checks, it provides paths to the XML and HTML versions of the lint report. You can then navigate to the HTML report and open it in your browser, as shown in figure 2.
If your project includes build
variants, lint checks only the default variant. If you want to run lint on a different
variant, you must capitalize the variant name and prefix it with lint.
./gradlew lintRelease
Note: Lint isn't automatically run as part of your build. We strongly recommend that you explicitly run lint as part of a continuous integration build so that you see the latest lint checks when building your existing source code.
To learn more about running Gradle tasks from the command line, read Build your app from the command line.
Run lint using the standalone tool
If you're not using Android Studio or Gradle,
install the Android SDK command-line tools
to use the standalone lint tool. Locate the lint tool
at android_sdk/cmdline-tools/version/bin/lint.
Note: If you attempt to run the standalone tool on a Gradle project, it gives
an error. You should always use gradle lint (on Windows) or ./gradlew
lint (on macOS or Linux) to run lint on a Gradle project.
To run lint against a list of files in a project directory, use the following command:
lint [flags] <project directory>
For example, you can issue the following command to scan the files under the
myproject directory and its subdirectories. The issue ID MissingPrefix
tells lint to only scan for XML attributes that are missing the Android namespace prefix.
lint --check MissingPrefix myproject
To see the full list of flags and command-line arguments supported by the tool, use the following command:
lint --help
The following example shows the console output when the lint command is run against a project called Earthquake:
$ lint Earthquake

Scanning Earthquake: ...............................................................................................................................
Scanning Earthquake (Phase 2): .......
AndroidManifest.xml:23: Warning: <uses-sdk> tag appears after <application> tag [ManifestOrder]
  <uses-sdk android:minSdkVersion="7" />
  ^
AndroidManifest.xml:23: Warning: <uses-sdk> tag should specify a target API level (the highest verified version; when running on later versions, compatibility behaviors may be enabled) with android:targetSdkVersion="?" [UsesMinSdkAttributes]
  <uses-sdk android:minSdkVersion="7" />
  ^
res: Warning: Missing density variation folders in res: drawable-xhdpi [IconMissingDensityFolder]
0 errors, 4 warnings
The example output lists three warnings and no errors.
Two warnings relate to the project's AndroidManifest.xml file:
ManifestOrderUsesMinSdkAttributes
One warning relates to the res directory:
IconMissingDensityFolder.
Configure lint to suppress warnings
By default, when you run a lint scan the tool checks for all issues that lint supports. You can also restrict the issues for lint to check, and you can assign severity levels for issues. For example, you can suppress lint checking for specific issues that are not relevant to your project, and you can configure lint to report non-critical issues at a lower severity level.
The severity levels are:
enabledisableorignoreinformationalwarningerrorfatal
You can configure lint checking for different levels:
- Globally (entire project)
- Project module
- Production module
- Test module
- Open files
- Class hierarchy
- Version Control System (VCS) scopes
Configure the lint file
You can specify your lint checking preferences in the lint.xml file. If you
are creating this file manually, place it in the root directory of your Android project.
The lint.xml file consists of an enclosing <lint> parent tag that
contains one or more children <issue> elements. Lint defines a unique
id attribute value for each <issue>:
<?xml version="1.0" encoding="UTF-8"?>
<lint>
    <!-- list of issues to configure -->
</lint>
To change an issue's severity level or disable lint checking for the issue,
set the severity attribute in the <issue> tag.
Tip: For a full list of lint-supported issues and their corresponding
issue IDs, run the lint --list command. The --list option must be run
from the standalone lint tool.
Sample lint.xml file
The following example shows the contents of a lint.xml file:
<?xml version="1.0" encoding="UTF-8"?>
<lint>
    <!-- Disable the ComposableNaming check in this project -->
    <issue id="ComposableNaming" severity="ignore" />

    <!-- Ignore the ComposeUnrememberedState issue in the specified files -->
    <issue id="ComposeUnrememberedState">
        <ignore path="src/main/java/com/example/myapp/MainActivity.kt" />
        <ignore path="src/main/java/com/example/myapp/ui/components/SpecialButton.kt" />
    </issue>

    <!-- Ignore the ComposeModifierMissing issue in the specified file -->
    <issue id="ComposeModifierMissing">
        <ignore path="src/main/java/com/example/myapp/ui/screens/HomeScreen.kt" />
    </issue>

    <!-- Change the severity of hardcoded strings to "error" -->
    <issue id="HardcodedText" severity="error" />
</lint>
This example shows how different issue types are configured. The
ComposableNaming
check is disabled completely, and the ComposeUnrememberedState check is disabled only
in the files specified in the enclosed <ignore ... /> declarations.
Configure lint checking for Kotlin and XML source files
You can turn off lint checking for your Kotlin and XML source files in the Preferences dialog:
- Select File > Settings (on Windows) or Android Studio > Preferences (on macOS or Linux).
- Select Editor > Inspections.
- To disable, deselect the appropriate source file.
You can set these either for the IDE or for individual projects by selecting the appropriate profile.
Configure lint checking in Kotlin
To disable lint checking specifically for a class or function in your Android project,
add the @SuppressLint annotation to that code.
The following example shows how you can turn off lint checking for the NewApi
issue in a specific function. The lint tool continues to check for the
NewApi issue in other functions of this class.
@SuppressLint("NewApi")
fun logNotificationChannelInfo() {
    // Uses NotificationChannel (requires API 26+)
    ...
}
The same can be accomplished on any Composable. The following code snippet shows how you can turn
off NewApi checks on any Composable.
  @SuppressLint("NewApi")
  @Composable
  fun MyComposable{
    ...
  }
The following example shows how to turn off lint checking for the ParserError
issue in the FeedProvider class:
@SuppressLint("ParserError")
class FeedProvider : ContentProvider() {
To suppress checking for all lint issues in the file, use the all keyword:
@SuppressLint("all")
You can use the same annotation to suppress lint checks on any Composable function.
Configure lint checking in XML
Use the tools:ignore attribute to turn off lint checking for specific
sections of your XML files. Put the following namespace value in the lint.xml file
so the lint tool recognizes the attribute:
namespace xmlns:tools="http://schemas.android.com/tools"The following example shows how you can turn off lint checking for the
UnusedResources issue in a <resources> element of a
strings.xml file. The ignore attribute is inherited by the children elements of the parent
element where the attribute is declared. In this example, the lint check is also disabled for all
enclosed <string> elements:
<resources
    xmlns:tools="http://schemas.android.com/tools"
    tools:ignore="UnusedResources" >

    <string name="app_name">My App</string>
    <string name="unused_string">Unused String</string>
</resources>
To disable more than one issue, list the issues to disable in a comma-separated string. For example:
tools:ignore="NewApi,StringFormatInvalid"
To suppress checking for all lint issues in the XML element, use the all
keyword:
tools:ignore="all"
Configure lint options with Gradle
The Android Gradle plugin lets you configure certain lint options,
such as which checks to run or ignore, using the
lint{} block in your module-level
build.gradle file.
The following code snippet shows some of the properties you can configure:
Kotlin
android {
    ...
    lint {
        // Turns off checks for the issue IDs you specify.
        disable += "TypographyFractions" + "TypographyQuotes"
        // Turns on checks for the issue IDs you specify. These checks are in
        // addition to the default lint checks.
        enable += "RtlHardcoded" + "RtlCompat" + "RtlEnabled"
        // To enable checks for only a subset of issue IDs and ignore all others,
        // list the issue IDs with the 'check' property instead. This property overrides
        // any issue IDs you enable or disable using the properties above.
        checkOnly += "NewApi" + "InlinedApi"
        // If set to true, turns off analysis progress reporting by lint.
        quiet = true
        // If set to true (default), stops the build if errors are found.
        abortOnError = false
        // If set to true, lint only reports errors.
        ignoreWarnings = true
        // If set to true, lint also checks all dependencies as part of its analysis.
        // Recommended for projects consisting of an app with library dependencies.
        checkDependencies = true
    }
}
...
Groovy
android {
    ...
    lint {
        // Turns off checks for the issue IDs you specify.
        disable 'TypographyFractions','TypographyQuotes'
        // Turns on checks for the issue IDs you specify. These checks are in
        // addition to the default lint checks.
        enable 'RtlHardcoded','RtlCompat', 'RtlEnabled'
        // To enable checks for only a subset of issue IDs and ignore all others,
        // list the issue IDs with the 'check' property instead. This property overrides
        // any issue IDs you enable or disable using the properties above.
        checkOnly 'NewApi', 'InlinedApi'
        // If set to true, turns off analysis progress reporting by lint.
        quiet true
        // If set to true (default), stops the build if errors are found.
        abortOnError false
        // If set to true, lint only reports errors.
        ignoreWarnings true
        // If set to true, lint also checks all dependencies as part of its analysis.
        // Recommended for projects consisting of an app with library dependencies.
        checkDependencies true
    }
}
...
All lint methods that override the given severity level of an issue respect the
order of configuration. For example, setting an issue as fatal in
finalizeDsl()
overrides disabling it in the main DSL.
Create a warnings baseline
You can take a snapshot of your project's current set of warnings, then use the snapshot as a baseline for future inspection runs so that only new issues are reported. The baseline snapshot lets you start using lint to fail the build without having to go back and address all existing issues first.
To create a baseline snapshot, modify your project's build.gradle file as follows:
Kotlin
android {
    lint {
        baseline = file("lint-baseline.xml")
    }
}
Groovy
android {
    lintOptions {
        baseline file("lint-baseline.xml")
    }
}
When you first add this line, the lint-baseline.xml file is created to establish
your baseline. From then on, the tools only read the file to determine the baseline. If you want
to create a new baseline, manually delete the file and run lint again to re-create it.
Then, run lint from the IDE by selecting Code > Inspect Code or from the command line
as follows. The output prints the location of the lint-baseline.xml file. The
file location for your setup might be different from what is shown here:
$ ./gradlew lintDebug -Dlint.baselines.continue=true
...
Wrote XML report to file:///app/lint-baseline.xml
Created baseline file /app/lint-baseline.xml
Running lint records all the
current issues in the lint-baseline.xml file. The set of current issues is
called the baseline. You can check the lint-baseline.xml
file into version control if you want to share it with others.
Customize the baseline
If you want to add only certain issue types to the baseline, specify the
issues to add by editing your project's build.gradle file as follows:
Kotlin
android {
    lint {
        checkOnly += "NewApi" + "HandlerLeak"
        baseline = file("lint-baseline.xml")
    }
}
Groovy
android {
    lintOptions {
        checkOnly 'NewApi', 'HandlerLeak'
        baseline file("lint-baseline.xml")
    }
}
If you add any new warnings to the codebase after you create the baseline, lint lists only the newly introduced bugs.
Baseline warning
When a baseline is in effect, you get an informational warning that tells you that one or more issues were filtered out because they are listed in the baseline. This warning helps you remember that you have configured a baseline and that you need to fix all of the issues at some point.
This informational warning also keeps track of issues that are no longer reported. This information lets you know if you have actually fixed issues, so you can optionally re-create the baseline to prevent an error from coming back undetected.
Note: Baselines are enabled when you run inspections in batch mode in the IDE, but they are ignored for the in-editor checks that run in the background when you are editing a file. This is because baselines are intended for the case where a codebase has a large number of existing warnings, but you do want to fix issues locally while you touch the code.
Run inspections manually
To manually run configured lint and other IDE inspections, select Code > Inspect Code. The results of the inspection appear in the Inspection Results window.
Set the inspection scope and profile
Select the files you want to analyze (the inspection scope) and the inspections you want to run (the inspection profile) as follows:
- In the Android view, open your project and select the project, folder, or file that you want to analyze.
- From the menu bar, select Code > Inspect Code.
In the Specify Inspection Scope dialog, review the settings.
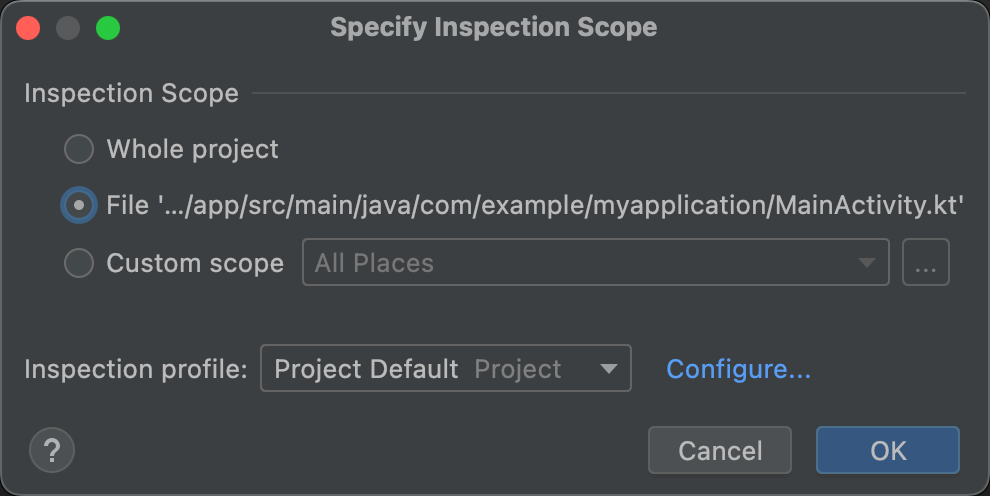
Figure 3. Review the inspection scope settings. The options that appear in the Specify Inspection Scope dialog varies depending on whether you selected a project, folder, or file:
- When you select one project, file, or directory, the Specify Inspection Scope dialog displays the path to the project, file, or directory you selected.
- When you select more than one project, file, or directory, the Specify Inspection Scope dialog displays a selected radio button for Selected files.
To change what to inspect, select one of the other radio buttons. See Specify Inspection Scope dialog for a description of all possible fields on the Specify Inspection Scope dialog.
- Under Inspection profile, select the profile you want to use.
Click OK to run the inspection.
Figure 4 shows lint and other IDE inspection results from the Inspect Code run:
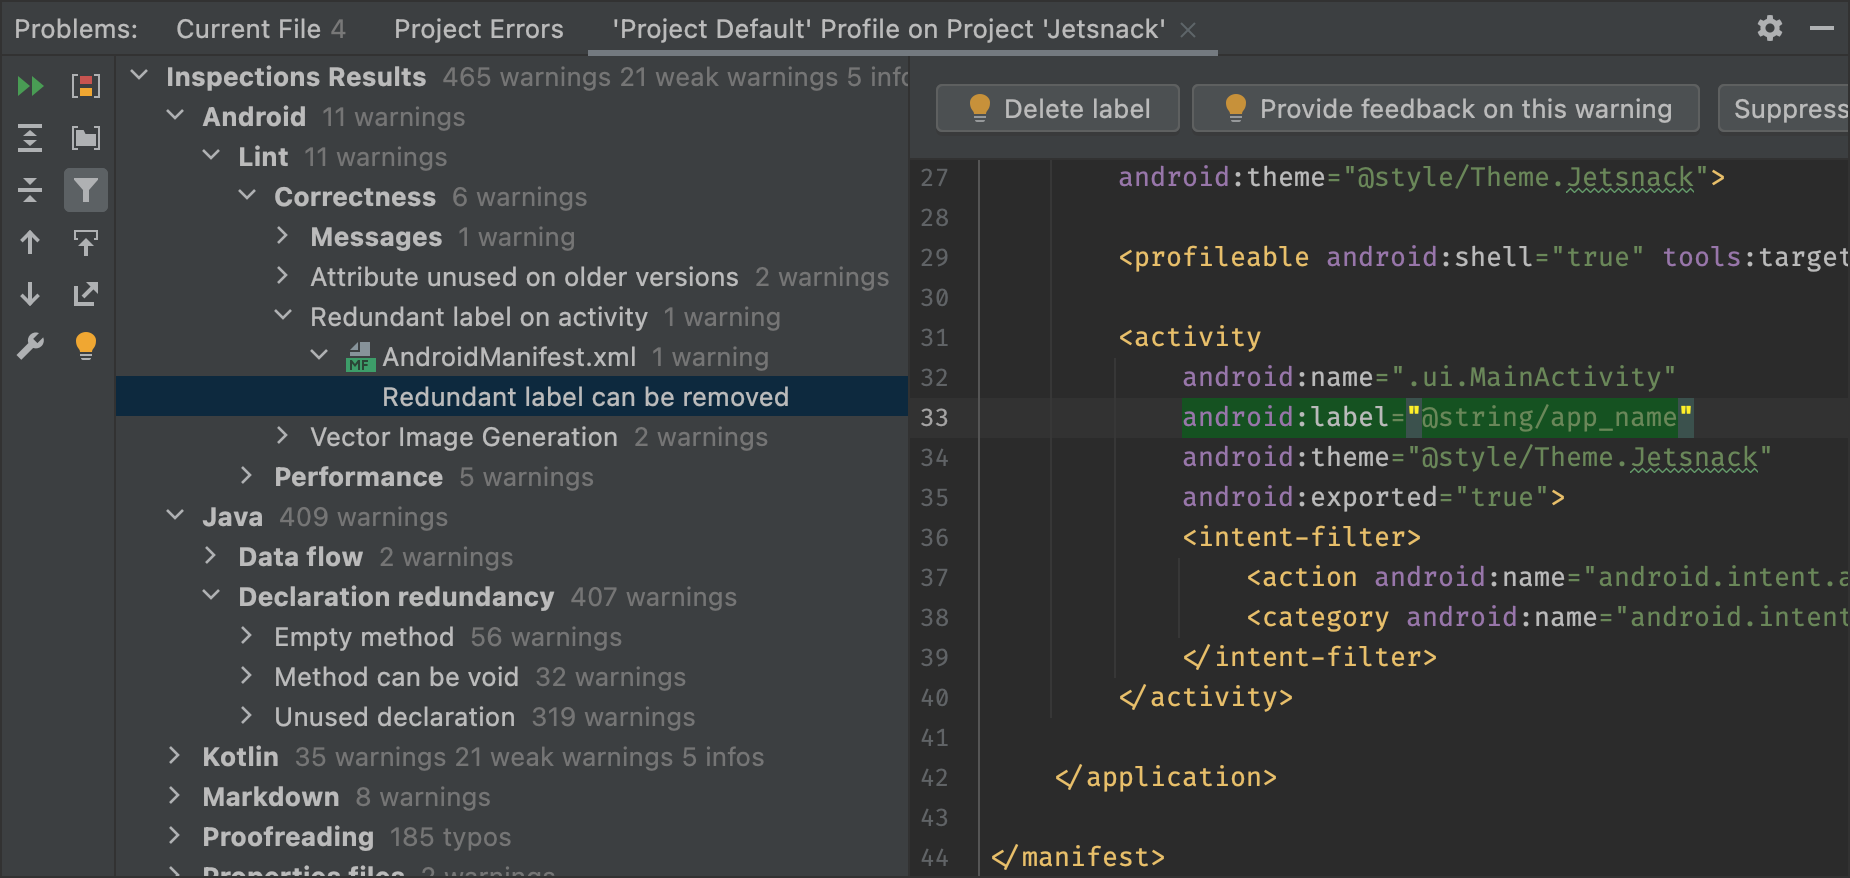
Figure 4. Results from the inspection. Select an issue to see the resolution. -
In the Inspection Results pane, view the inspection results by expanding and selecting error categories, types, or issues.
The Inspection Report pane displays the inspection report for the error category, type, or issue selected in the Inspection Results pane and displays the name and location of the error. Where applicable, the inspection report displays other information, such as a problem synopsis, to help you correct the problem.
In the Inspection Results pane tree view, right-click a category, type, or issue to display the context menu.
Depending on the context, you can:
- Jump to source.
- Exclude and include selected items.
- Suppress problems.
- Edit settings.
- Manage inspection alerts.
- Rerun an inspection.
For descriptions of the toolbar buttons, context menu items, and inspection report fields, see Inspection Results tool window.
Use a custom scope
Use one of the custom scopes provided in Android Studio as follows:
- In the Specify Inspection Scope dialog, select Custom scope.
Click the Custom scope list to display your options:
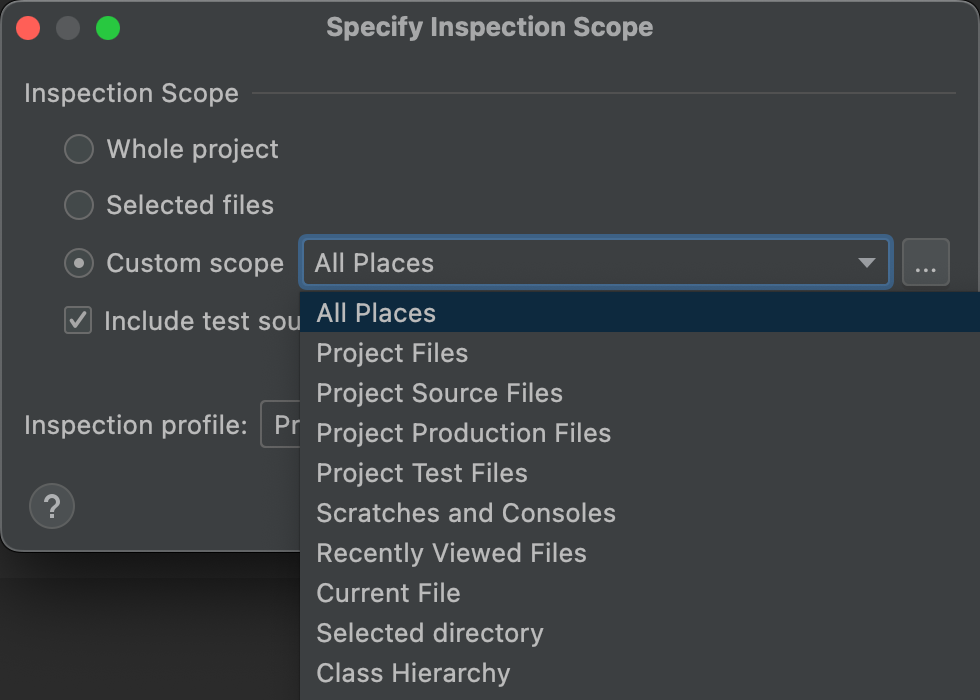
Figure 5. Select which custom scope you want to use. - All Places: All files.
- Project Files: All the files in the current project.
- Project Source Files: Only the source files in the current project.
- Project Production Files: Only the production files in the current project.
- Project Test Files: Only the test files in the current project.
- Scratches and Consoles: Only the scratch files and consoles you have open in the current project.
- Recently Viewed Files: Only recently viewed files in the current project.
- Current File: Only the current file in your current project. Appears when you have a file or folder selected.
- Selected Directory: Only the current folder in your current project. Appears when you have a folder selected.
- Class Hierarchy: When you select this option and click OK, a dialog appears with all of the classes in the current project. In the dialog, use the Search by Name field to filter and select the classes to inspect. If you don't filter the classes list, code inspection inspects all of the classes.
- Click OK.
If you have a VCS configured for the project, there are also options to restrict the search to only files that have been modified.
Create a custom scope
When you want to inspect a selection of files and directories that isn't covered by any of the available custom scopes, you can create a custom scope:
- In the Specify Inspection Scope dialog, select Custom scope.
Click the three dots after the Custom Scope list.
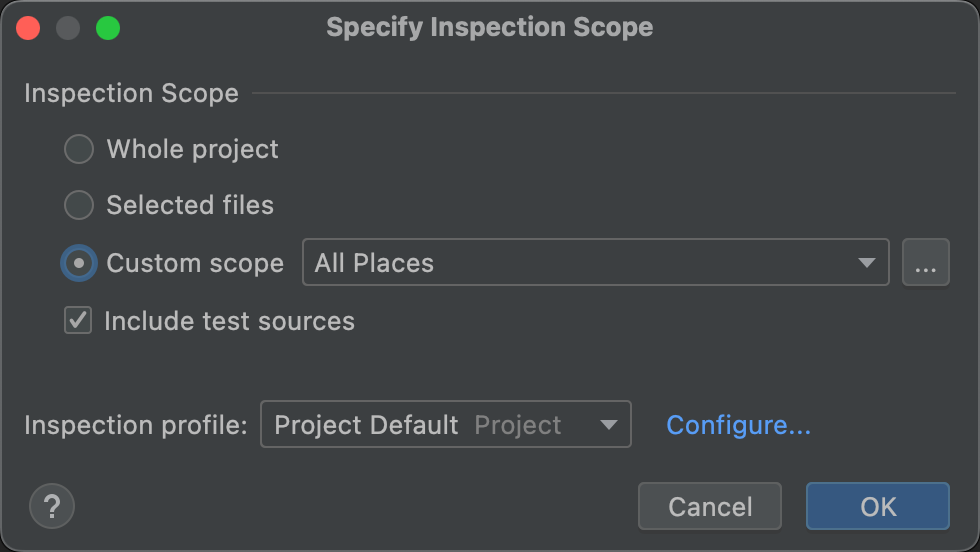
Figure 6. Specify Inspection Scope dialog. The Scopes dialog appears.
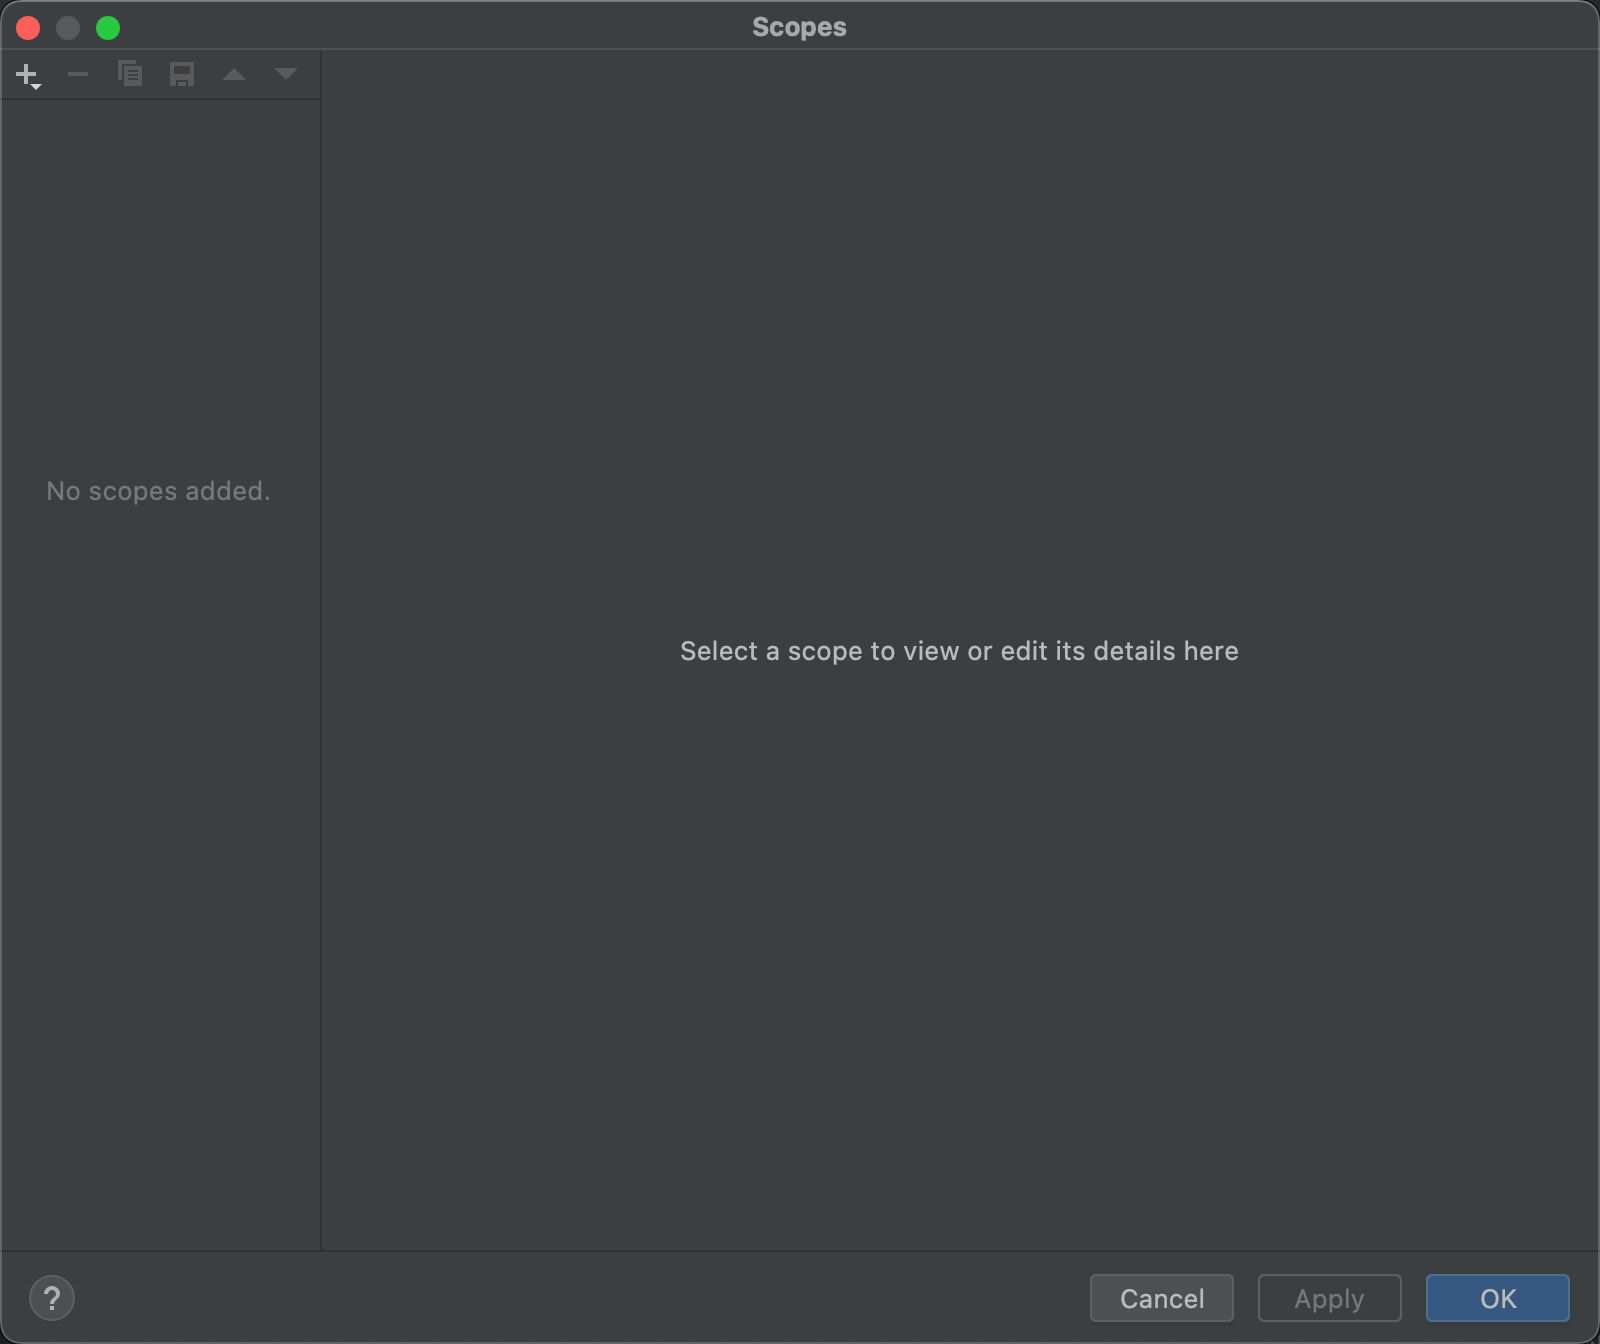
Figure 7. Create a custom scope. - Click the
 button in the top-left corner of the dialog to define a new scope.
 - In the Add Scope list that appears, select Local.
Both the local and shared scopes are used within the project for the Inspect Code feature. A Shared scope can also be used with other project features that have a scope field. For example, when you click Edit Settings
 to change the
settings for Find Usages, the resulting dialog has a Scope field where you can
select a shared scope.
to change the
settings for Find Usages, the resulting dialog has a Scope field where you can
select a shared scope.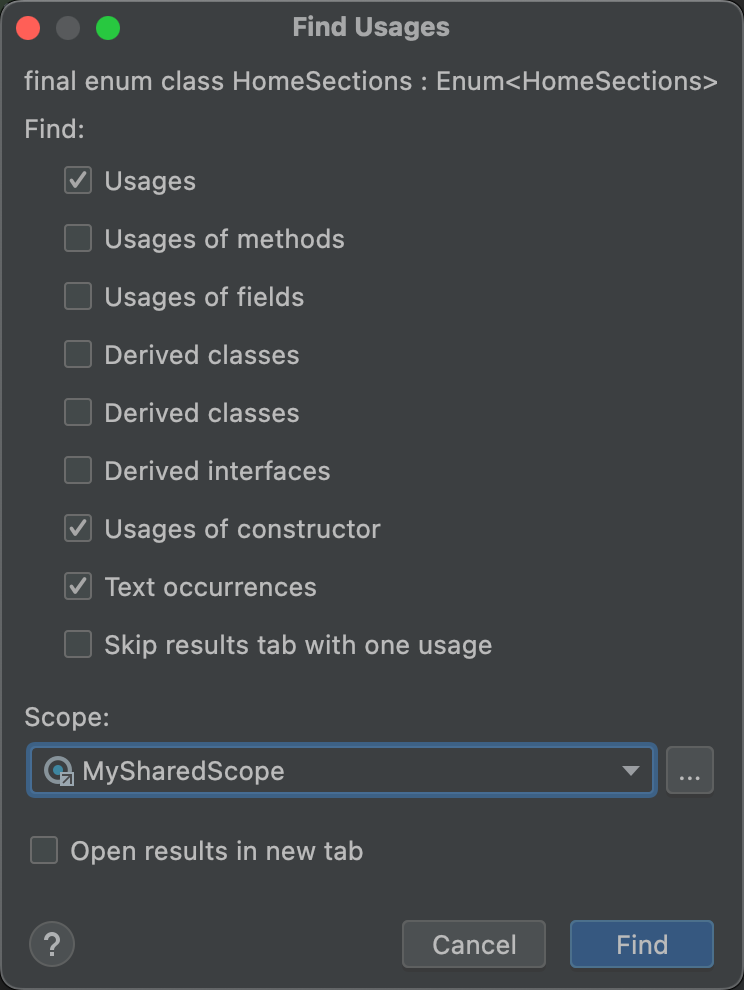
Figure 8. Select a shared scope from the Find Usages dialog. - Give the scope a name and click OK.
The right pane of the Scopes dialog populates with options that let you define the custom scope.
- From the list, select Project.
A list of available projects appears.
Note: You can create the custom scope for projects or packages. The steps are the same.
Expand the project folders, select what you want to add to the custom scope, and select whether to include or exclude it.
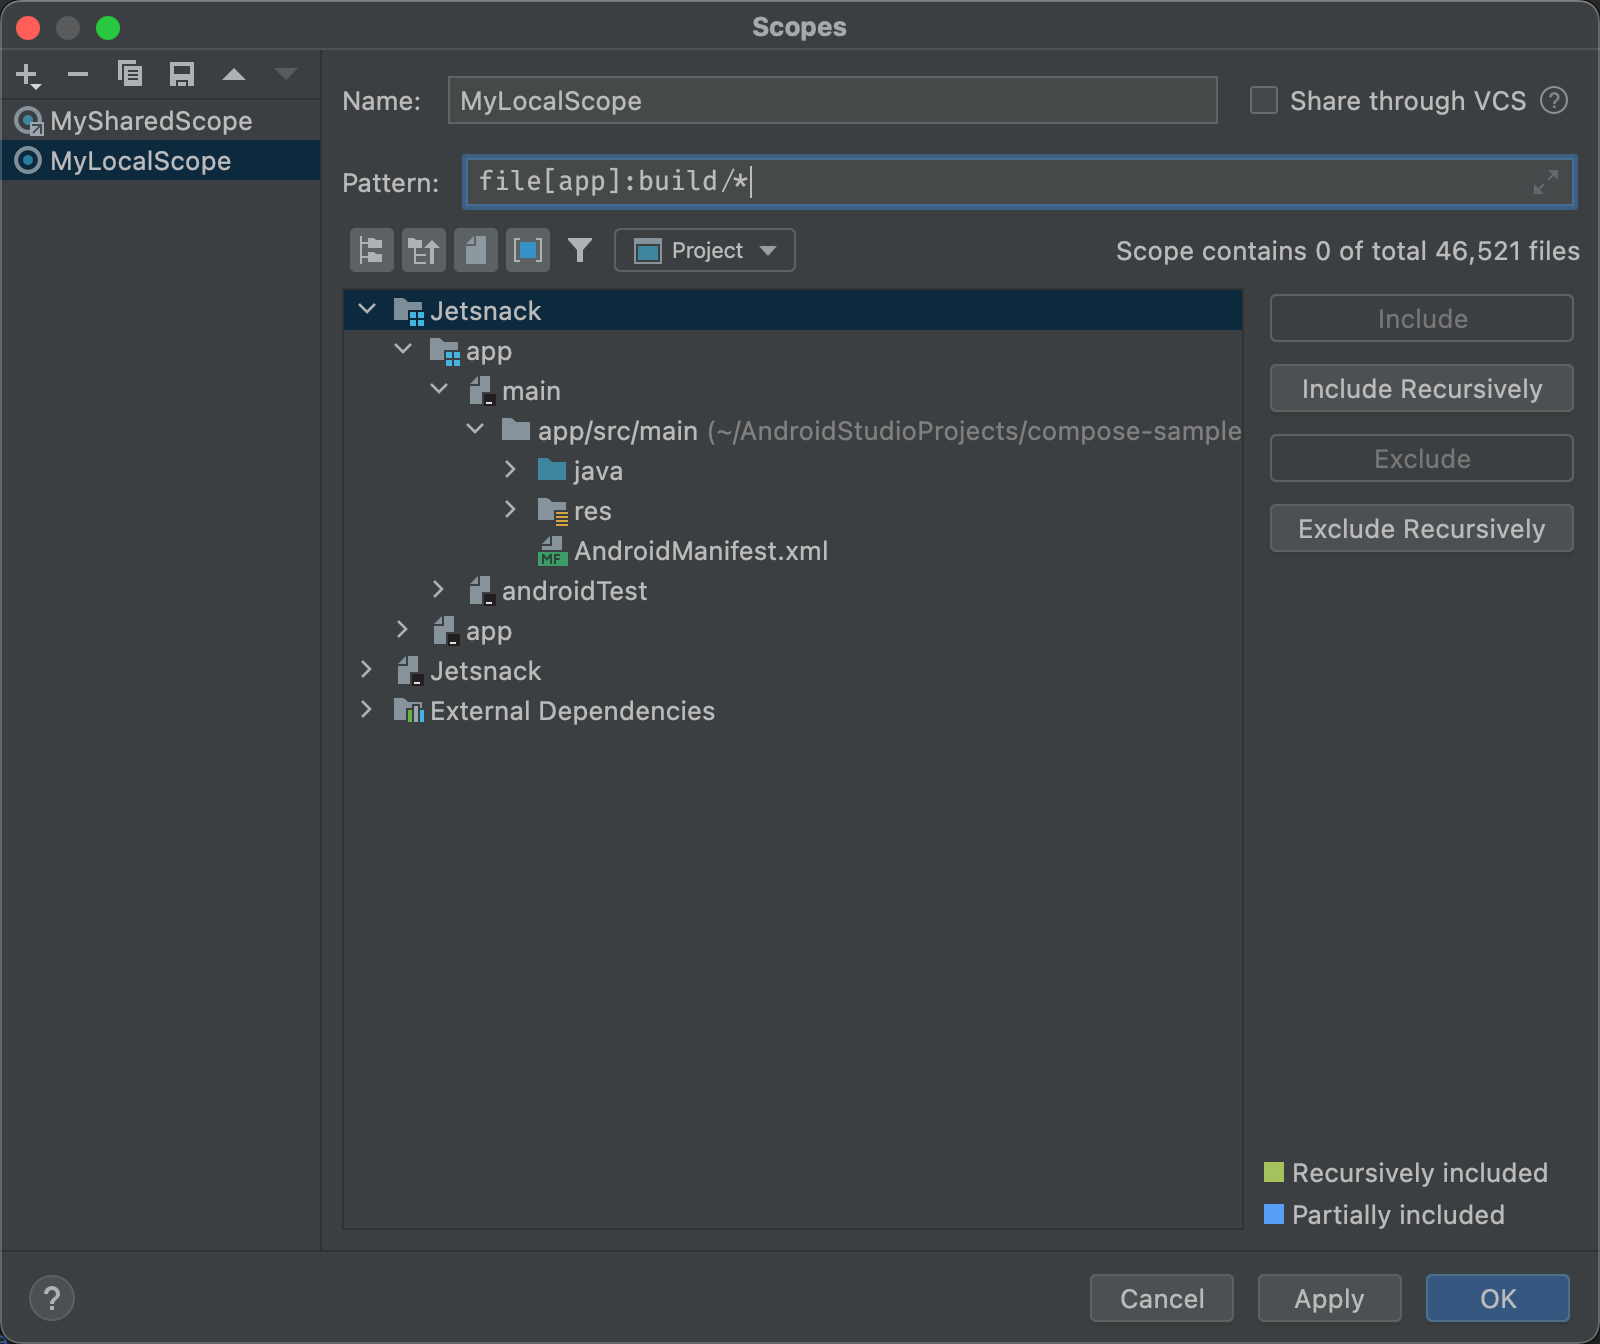
Figure 9. Define a custom scope. - Include: Include this folder and its files, but don't include any of its subfolders.
- Include Recursively: Include this folder and its files as well as its subfolders and their files.
- Exclude: Exclude this folder and its files, but don't exclude any of its subfolders.
- Exclude Recursively: Exclude this folder and its files as well as its subfolders and their files.
Figure 10 shows that the main folder is included, and that the java and res folders are included recursively. Blue indicates a partially included folder, and green indicates recursively included folders and files.
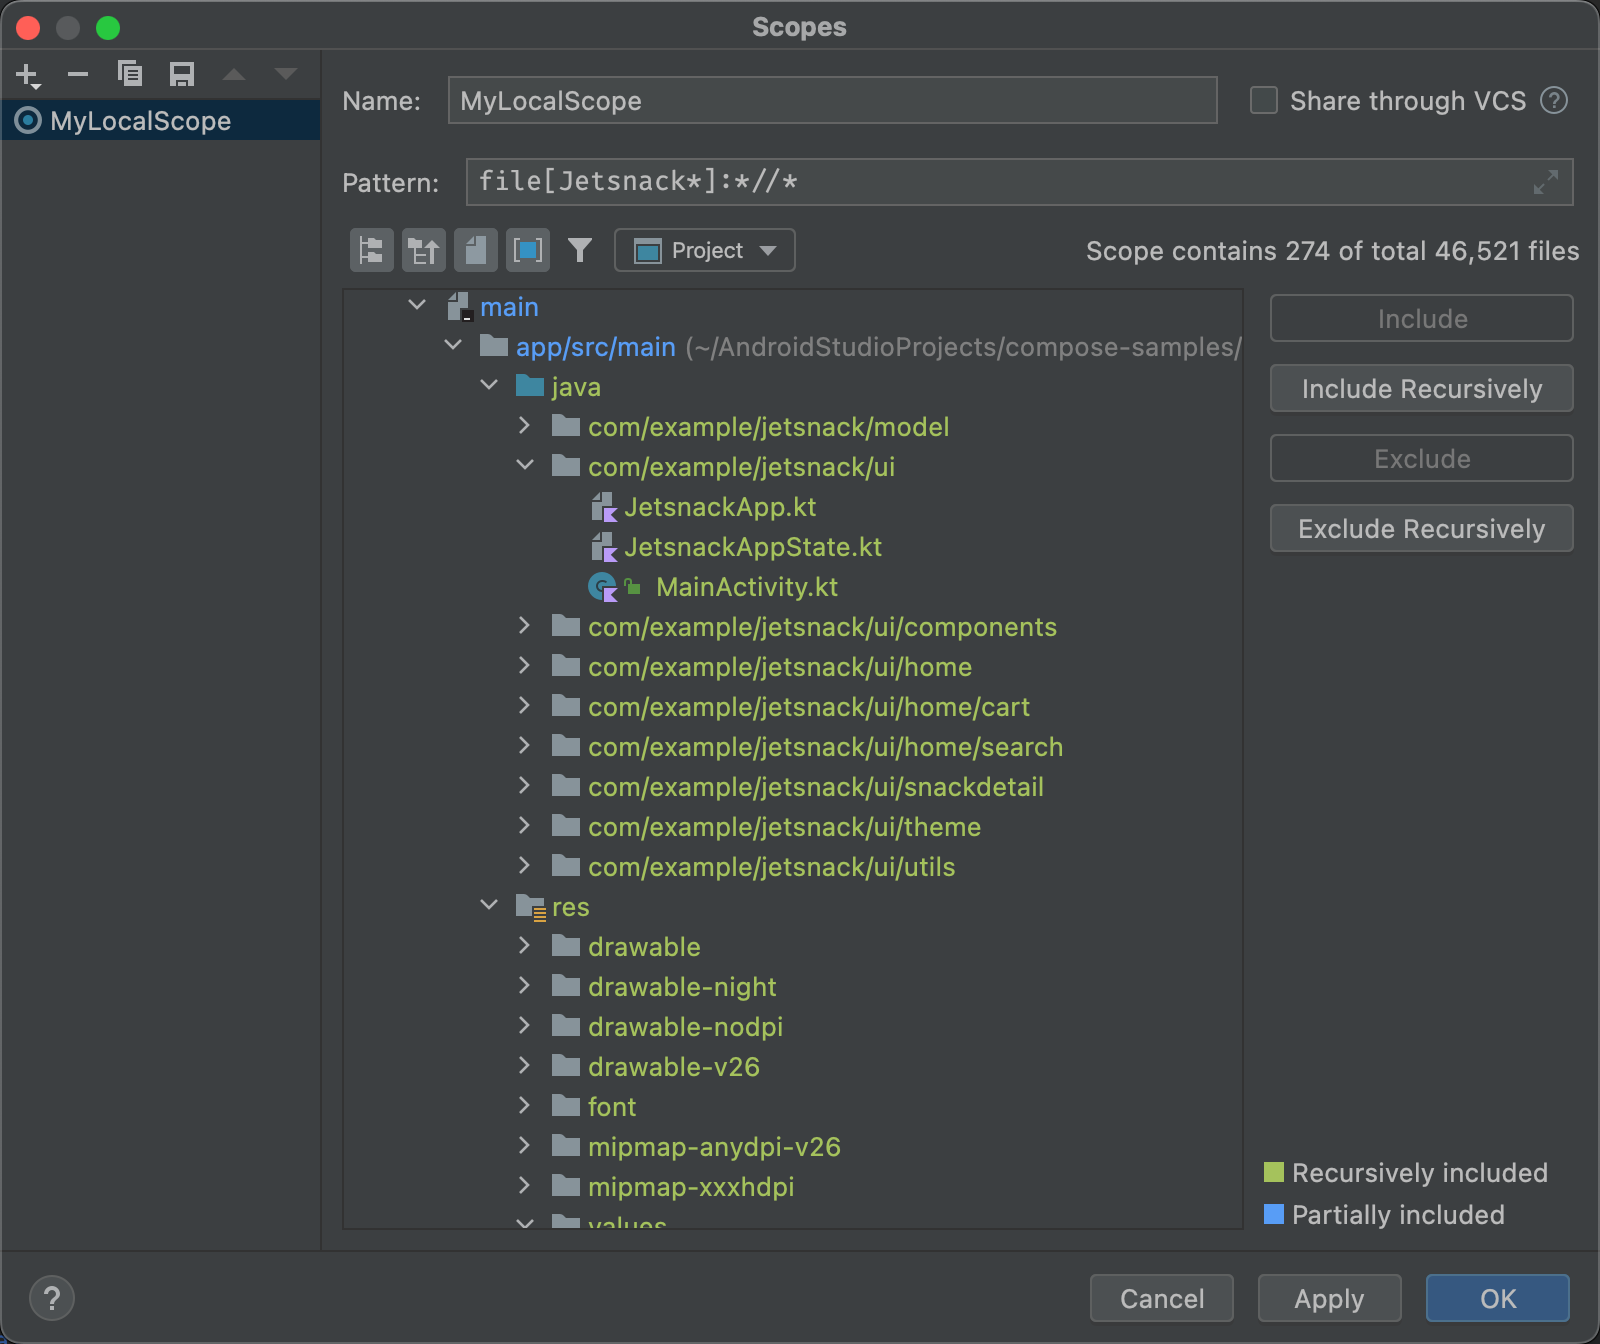
Figure 10. Example pattern for a custom scope. - If you select the java folder and click Exclude Recursively, the green highlighting goes away on the java folder and all the folders and files under it.
- If you select the green-highlighted MainActivity.kt file and click Exclude, MainActivity.kt is no longer highlighted green, but everything else under the java folder remains green.
- Click OK. The custom scope appears at the bottom of the list.
Review and edit inspection profiles
Android Studio has a selection of lint and other inspection profiles that are updated through Android updates. You can use these profiles as they are or edit their names, descriptions, severities, and scopes. You can also activate and deactivate entire groups of profiles or individual profiles within a group.
To access the Inspections settings:
- Select File > Settings. (on Windows) or Android Studio > Preferences (on macOS or Linux).
- Select Editor > Inspections.
-
The Inspections pane shows a list of the supported inspections and their descriptions.
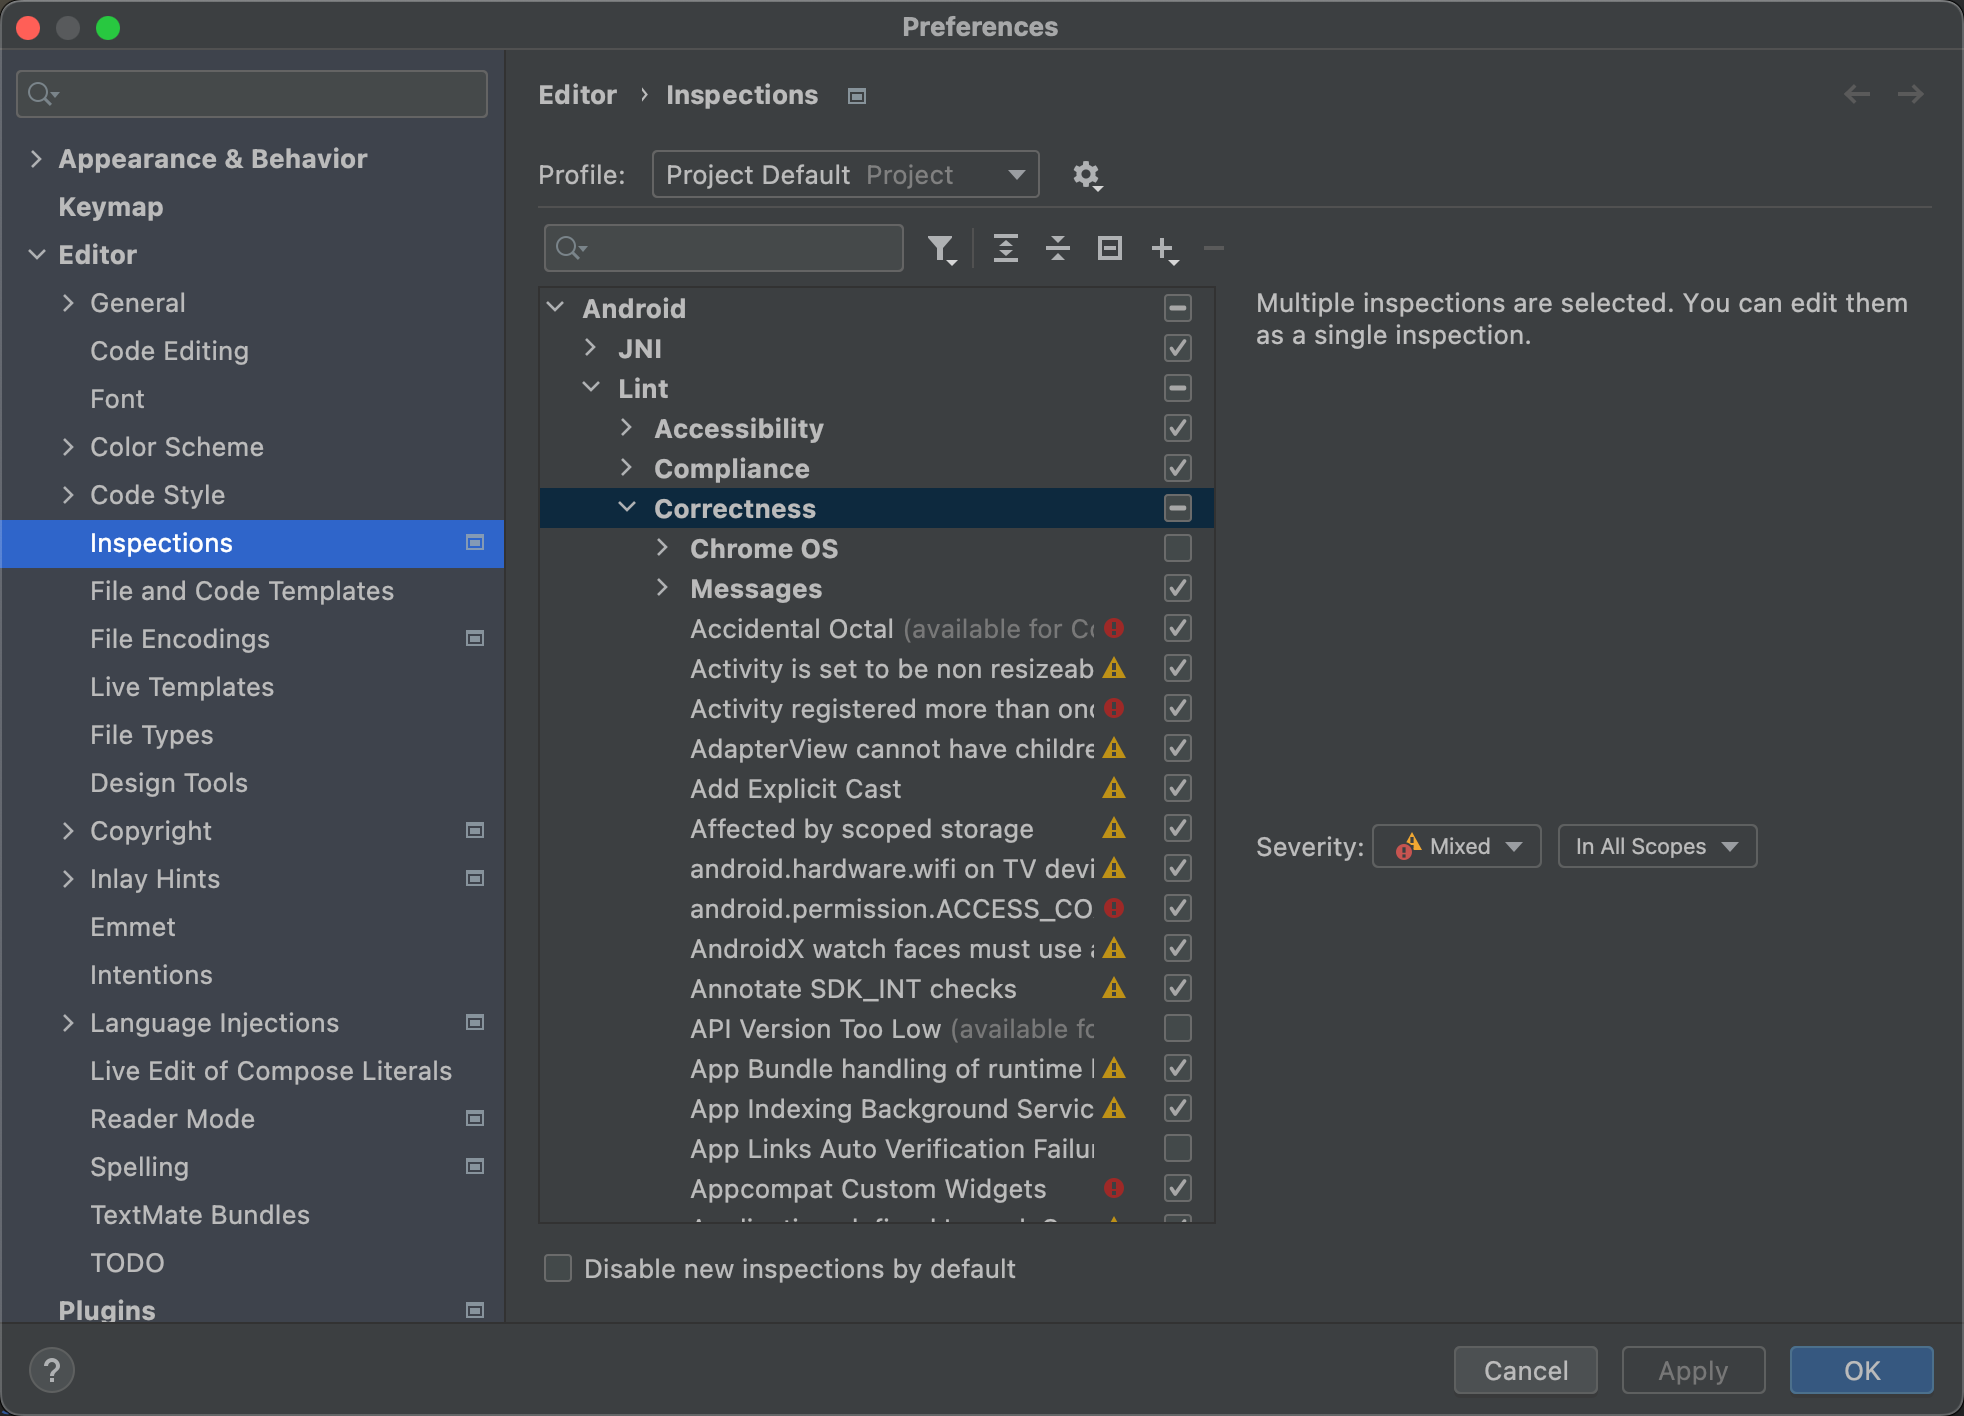
Figure 11. Supported inspections and their descriptions. Select the Profile list to toggle between Default (Android Studio) and Project Default (the active project) inspections.
For more information, see the IntelliJ Manage profiles page.
In the Inspections list in the left pane, select a top-level profile category or expand a group and select a specific profile.
When you select a profile category, you can edit all the inspections in that category as a single inspection.
- Select the Show Schema Actions
 list to copy, rename, add
descriptions to, export, and import inspections.
list to copy, rename, add
descriptions to, export, and import inspections. - When you're done, click OK.