
When the UI thread of an Android app is blocked for too long, the system sends an "Application Not Responding" (ANR) error. This page describes the different types of ANRs, how to diagnose them, and suggestions for fixing them. All the default timeout time ranges listed are for AOSP and Pixel devices; these times can vary by OEM.
Keep in mind that when determining the cause of ANRs, it's helpful to distinguish between system and app issues.
When the system is in a bad state, the following issues can cause ANRs:
- Transient issues in the system server cause usually fast binder calls to be slow.
- Issues with the system server and high device load cause app threads to not be scheduled.
If available to you, a good way to distinguish between system and app issues is to use Perfetto traces:
- See whether the app's main thread is scheduled by looking at the thread state track in Perfetto to see if it's running or runnable.
- Look at the
system_serverthreads for issues such as lock contention. - For slow binder calls, look at the reply thread, if present, to see why it's slow.
Input dispatch timeout
Input dispatch ANRs occur when the app's main thread doesn't respond to an input event, such as a swipe or key press, in time. Since the app is in the foreground when input dispatch timeouts occur, they're almost always visible to the user and very important to mitigate.
Default timeout period: 5 seconds.
Input dispatch ANRs are usually caused by issues on the main thread. If the main thread was blocked waiting to acquire a lock, the holder thread can also be involved.
To avoid input dispatch ANRs, following these best practices:
- Don't perform blocking or long-running operations on the main thread. Consider
using
StrictModeto catch accidental activity on the main thread. - Minimize lock contention between main thread and other threads.
- Minimize non-UI work on the main thread, such as when handling broadcasts or running services.
Common causes
Here are some common causes and suggested fixes for input dispatch ANRs.
| Cause | What happens | Suggested fixes |
|---|---|---|
| Slow binder call | Main thread makes a long synchronous binder call. | Move the call off the main thread or try to optimize the call, if you own the API. |
| Many consecutive binder calls | Main thread makes many consecutive synchronous binder calls. | Don't perform binder calls in a tight loop. |
| Blocking I/O | Main thread makes blocking I/O call, such as database or network access. | Move all blocking IO off the main thread. |
| Lock contention | Main thread is blocked waiting to acquire a lock. | Reduce lock contention between the main thread and other thread. Optimize slow code in the other thread. |
| Expensive frame | Rendering too much in a single frame, causing severe jank. | Do less work rending the frame. Don't use n2 algorithms. Use efficient components for things like scrolling or paging—for example, the Jetpack Paging library. |
| Blocked by other component | A different component, such as a broadcast receiver, is running and blocking the main thread. | Move non-UI work off the main thread as much as possible. Run broadcast receivers on a different thread. |
| GPU hang | GPU hang is a system or hardware issue that causes rendering to be blocked and hence an input dispatch ANR. | Unfortunately, there usually aren't any fixes on the app side. If possible, contact the hardware team to troubleshoot. |
How to debug
Start debugging by looking at the ANR cluster signature in Google Play Console or Firebase Crashlytics. The cluster typically contains the top frames suspected of causing the ANR.
The following flow chart shows how to determine the cause of an input timeout dispatch ANR.
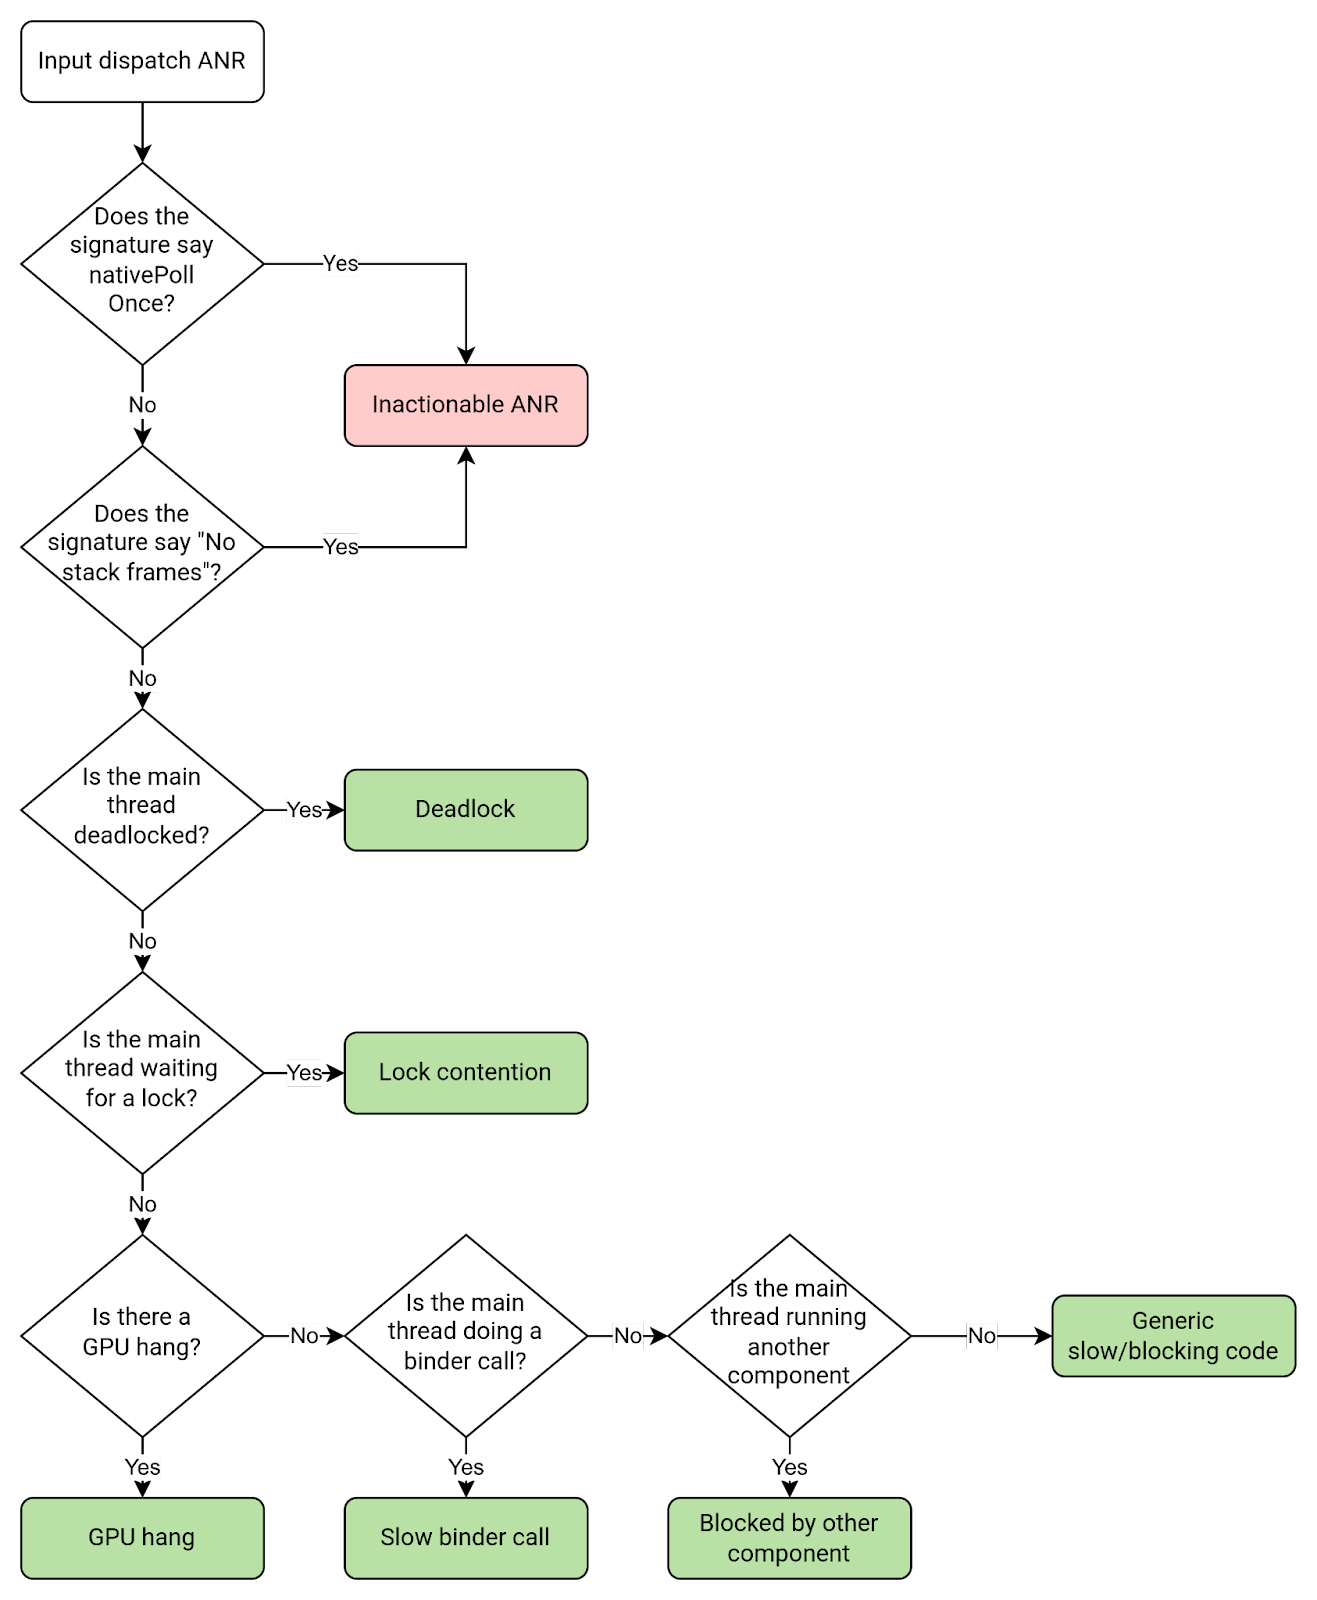
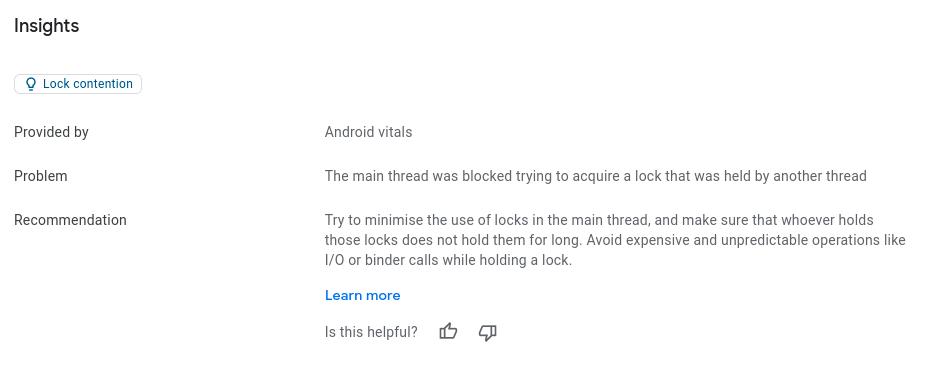
Play vitals can detect and help debug some of these common ANR causes. For example, if vitals detect that an ANR occurred because of lock contention, it can summarize the problem and recommended fix in the ANR Insights section.
No focused window
While events like touch are sent directly to the relevant window based on hit testing, events such as keys need a target. This target is referred to as the focused window. There's only one focused window per display, and it's usually the window that the user is currently interacting with. If a focused window can't be found, input raises a no-focused-window ANR. A no-focused-window ANR is a type of input dispatch ANR.
Default timeout period: 5 seconds.
Common causes
No-focused-window ANRs are usually caused by either of the following issues:
- The app is doing too much work and is too slow to draw the first frame.
- The main window is not focusable. If a window is flagged with
FLAG_NOT_FOCUSABLE, the user can't send key or button events to it.
Kotlin
override fun onCreate(savedInstanceState: Bundle) {
  super.onCreate(savedInstanceState)
  setContentView(R.layout.activity_main)
  window.addFlags(WindowManager.LayoutParams.FLAG_FLAG_NOT_FOCUSABLE)
}
Java
@Override
protected void onCreate(Bundle savedInstanceState) {
  super.onCreate(savedInstanceState);
  setContentView(R.layout.activity_main);
  getWindow().addFlags(WindowManager.LayoutParams.FLAG_NOT_FOCUSABLE);
}
Broadcast receiver timeout
A broadcast receiver ANR occurs when a broadcast receiver doesn't handle a
broadcast in time. For synchronous receivers, or receivers that don't call
goAsync(), a timeout means that onReceive() didn't complete in
time. For async receivers, or receivers that call goAsync(), a timeout means
that PendingResult.finish() wasn't called in time.
Broadcast receiver ANRs often happen in these threads:
- Main thread, if the issue is slow app startup.
- Thread running broadcast receiver, if the issue is slow
onReceive()code. - Broadcast worker threads, if the issue is slow
goAsync()broadcast code.
To avoid broadcast receiver ANRs, follow these best practices:
- Make sure that app startup is fast, since it's counted in the ANR timeout if the app is started to handle the broadcast.
- If
goAsync()is used, make surePendingResult.finish()is called quickly. This is subject to the same ANR timeout as synchronous broadcast receivers. - If
goAsync()is used, make sure the worker thread(s) aren't shared with other long-running or blocking operations. - Consider using
registerReceiver()to run broadcast receivers in a non-main thread, to avoid blocking UI code running in the main thread.
Timeout periods
Broadcast receive timeout periods depend on whether the foreground intent flag is set, and the platform version.
| Intent type | Android 13 and lower | Android 14 and higher |
|---|---|---|
Foreground priority intent ( |
10 seconds |
10-20 seconds, depending on whether process is CPU-starved |
Background priority intent ( |
60 seconds |
60-120 seconds, depending on whether process is CPU-starved |
To tell if the FLAG_RECEIVER_FOREGROUND flag is set, look for "flg=" in the
ANR subject and check for the presence of 0x10000000. If this bit is set, then
the intent has FLAG_RECEIVER_FOREGROUND set and hence the timeout is shorter.
Example ANR subject with short broadcast timeout (10-20 seconds):
Broadcast of Intent { act=android.inent.action.SCREEN_ON flg=0x50200010 }
Example ANR subject with long broadcast timeout (60-120 seconds):
Broadcast of Intent { act=android.intent.action.TIME_SET flg=0x25200010 }
How broadcast times are measured
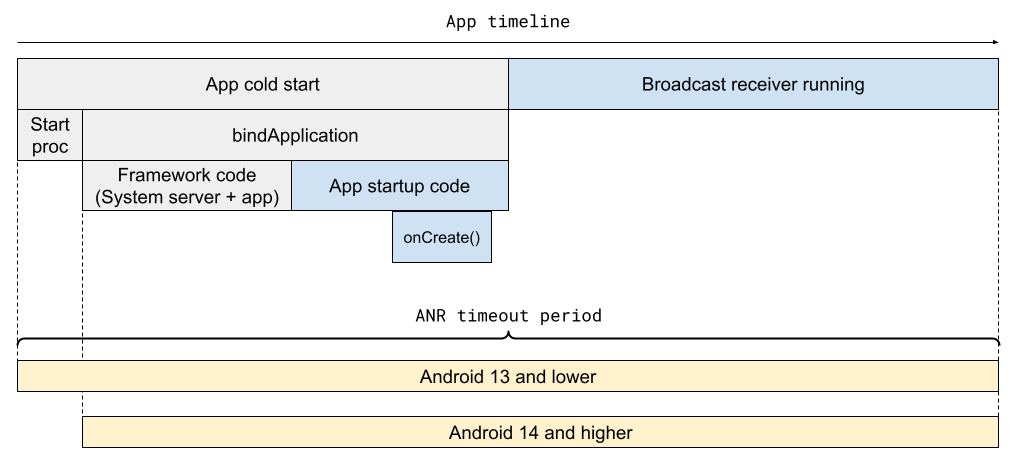
The broadcast duration measurement starts when the broadcast is dispatched from
system_server to the app, and finishes when the app finishes processing the
broadcast. If the app process wasn't already running, it also needs to do a cold
start within the ANR timeout period. Hence, slow app startup can result in
broadcast receiver ANRs.
The following figure illustrates the broadcast receiver ANR timeline aligns with certain app processes.
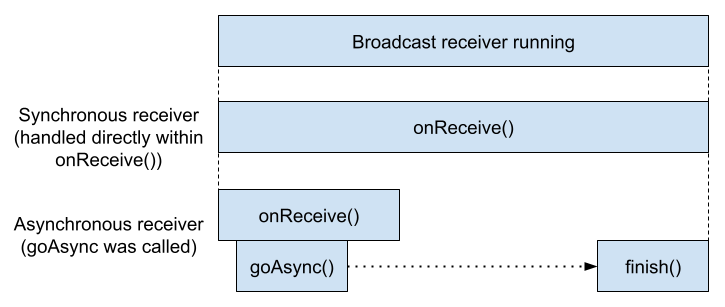
The ANR timeout measurement ends when the receiver finishes processing the broadcast: when exactly this happens depends on whether it's a synchronous or asynchronous receiver.
- For synchronous receivers, the measurement stops when
onReceive()returns. - For asynchronous receivers, the measurement stops when
PendingResult.finish()is called.
Common causes
Here are some common causes and suggested fixes for broadcast receiver ANRs.
| Cause | Applies to | What happened | Suggested fix |
|---|---|---|---|
| Slow app startup | All receivers | The app took too long to do a cold start. | Optimize slow app start. |
onReceive() not scheduled | All receivers | The broadcast receiver thread was busy doing other work and could not
start the onReceive() method. | Don't perform long-running tasks on receiver thread (or move receiver to dedicated thread). |
Slow onReceive() | All receivers, but mainly synchronous ones | The onReceive() method started but
was blocked or slow so did not complete in time. | Optimize slow receiver code. |
| Async receiver tasks not scheduled | goAsync()
receivers | The onReceive() method tried to execute work
on a blocked worker thread pool, so the work never started. |
Optimize slow or blocking calls, or use different threads for broadcast workers vs other long-running tasks. |
| Workers slow or blocked | goAsync() receivers |
There was a blocking or slow operation somewhere in the worker thread
pool while processing the broadcast. So, PendingResult.finish
was not called in time. | Optimize slow async receiver
code. |
Forgot to call PendingResult.finish |
goAsync() receivers |
Call to finish() is missing from the code path. |
Ensure finish() is always called. |
How to debug
Based on the cluster signature and ANR report, you can locate the thread that the receiver runs on, and then the specific code that is missing or running slowly.
The following flow chart shows how to determine the cause of a broadcast receiver ANR.
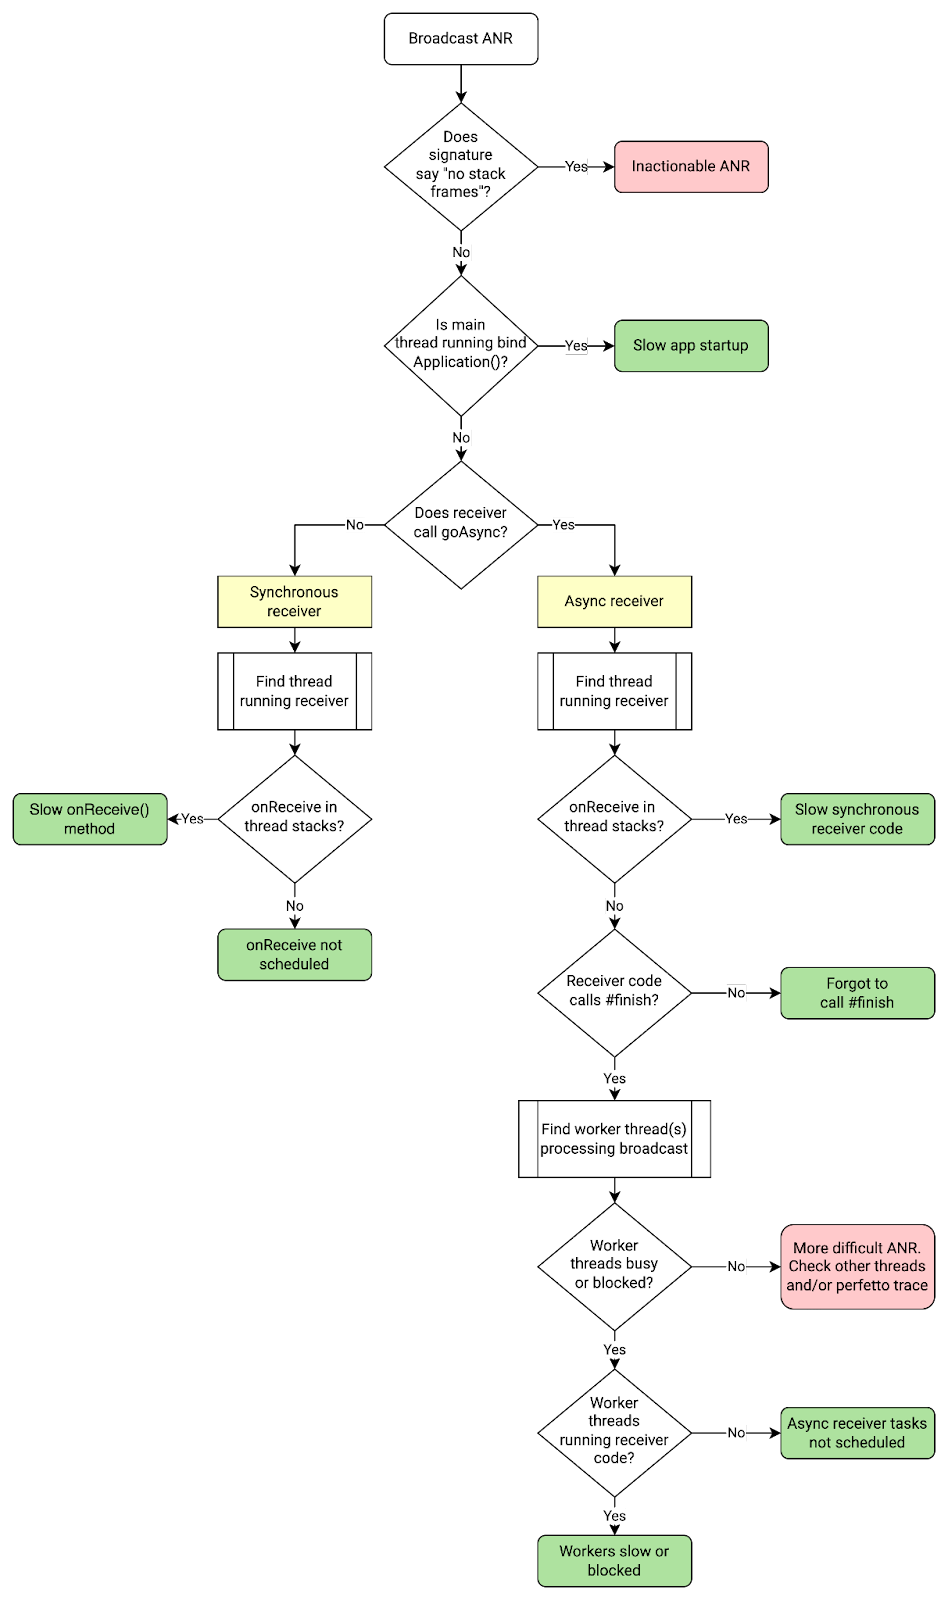
Find the receiver code
Google Play Console shows the receiver class and broadcast intent in the ANR signature. Look for the following:
cmp=<receiver class>act=<broadcast_intent>
Here's an example of a broadcast receiver ANR signature:
com.example.app.MyClass.myMethod
Broadcast of Intent { act=android.accounts.LOGIN_ACCOUNTS_CHANGED
cmp=com.example.app/com.example.app.MyAccountReceiver }
Find the thread running the onReceive() method
If you're using Context.registerReceiver to specify a custom handler,
it's the thread running this handler. Otherwise, it's the main thread.
Example: async receiver tasks not scheduled
This section walks through an example of how to debug a broadcast receiver ANR.
Say the ANR signature looks like the following:
com.example.app.MyClass.myMethod
Broadcast of Intent {
act=android.accounts.LOG_ACCOUNTS_CHANGED cmp=com.example.app/com.example.app.MyReceiver }
Based on the signature, it looks like the broadcast intent is
android.accounts.LOG_ACCOUNTS_CHANGED and the receiver class is
com.example.app.MyReceiver.
From the receiver code, you can determine that the thread pool "BG Thread
[0,1,2,3]" does the main work to process this broadcast. Looking at the stack
dumps, you can see that all four background (BG) threads have the same pattern:
they run a blocking call, getDataSync. Since all the BG threads were busy, the
broadcast couldn't be processed in time, which led to an ANR.
BG Thread #0 (tid=26) Waiting

at jdk.internal.misc.Unsafe.park(Native method:0)
at java.util.concurrent.locks.LockSupport.park(LockSupport.java:211)
at com.google.common.util.concurrent.AbstractFuture.get(AbstractFuture:563)
at com.google.common.util.concurrent.ForwardingFuture.get(ForwardingFuture:68)
at com.example.app.getDataSync(<MyClass>:152)

...

at java.util.concurrent.ThreadPoolExecutor.runWorker(ThreadPoolExecutor.java:1145)
at java.util.concurrent.ThreadPoolExecutor$Worker.run(ThreadPoolExecutor.java:644)
at com.google.android.libraries.concurrent.AndroidExecutorsModule.lambda$withStrictMode$5(AndroidExecutorsModule:451)
at com.google.android.libraries.concurrent.AndroidExecutorsModule$$ExternalSyntheticLambda8.run(AndroidExecutorsModule:1)
at java.lang.Thread.run(Thread.java:1012)
at com.google.android.libraries.concurrent.ManagedPriorityThread.run(ManagedPriorityThread:34)
There are several approaches to fix the issue:
- Find out why
getDataSyncis slow and optimize. - Don't run
getDataSyncon all four BG threads. - More generally, ensure that the BG thread pool isn't saturated with long-running operations.
- Use a dedicated thread pool for
goAsyncworker tasks. - Use an unbounded thread pool instead of the bounded BG thread pool
Example: slow app startup
A slow app startup can cause several types of ANRs, especially broadcast
receiver and execute service ANRs. The cause of an
ANR is likely slow app startup if you see ActivityThread.handleBindApplication
in the main thread stacks.
Execute service timeout
An execute service ANR happens when the app's main thread doesn't start a
service in time. Specifically, a service doesn't finish executing
onCreate() and onStartCommand() or onBind() within the
timeout period.
Default timeout period: 20 seconds for foreground service; 200 seconds for
background service. The ANR timeout period includes the app cold start, if
necessary, and calls to onCreate(), onBind(), or onStartCommand().
To avoid execute service ANRs, follow these general best practices:
- Make sure that app startup is fast, since it's counted in the ANR timeout if the app is started to run the service component.
- Make sure that the service's
onCreate(),onStartCommand(), andonBind()methods are fast. - Avoid running any slow or blocking operations on the main thread from other components; these operations can prevent a service from starting quickly.
Common causes
The following table lists common causes of execute service ANRs and suggested fixes.
| Cause | What | Suggested fix |
|---|---|---|
| Slow app startup | The app takes too long to perform a cold start. | Optimize slow app start. |
Slow onCreate(), onStartCommand(), or
onBind() |
The service component's onCreate(),
onStartCommand(), or onBind() method takes too long to
execute on the main thread. |
Optimize slow code. Move slow operations off the critical path where possible. |
Not scheduled (main thread blocked before onStart()) |
The app's main thread is blocked by another component before the service can be started. | Move other component's work off the main thread. Optimize other component's blocking code. |
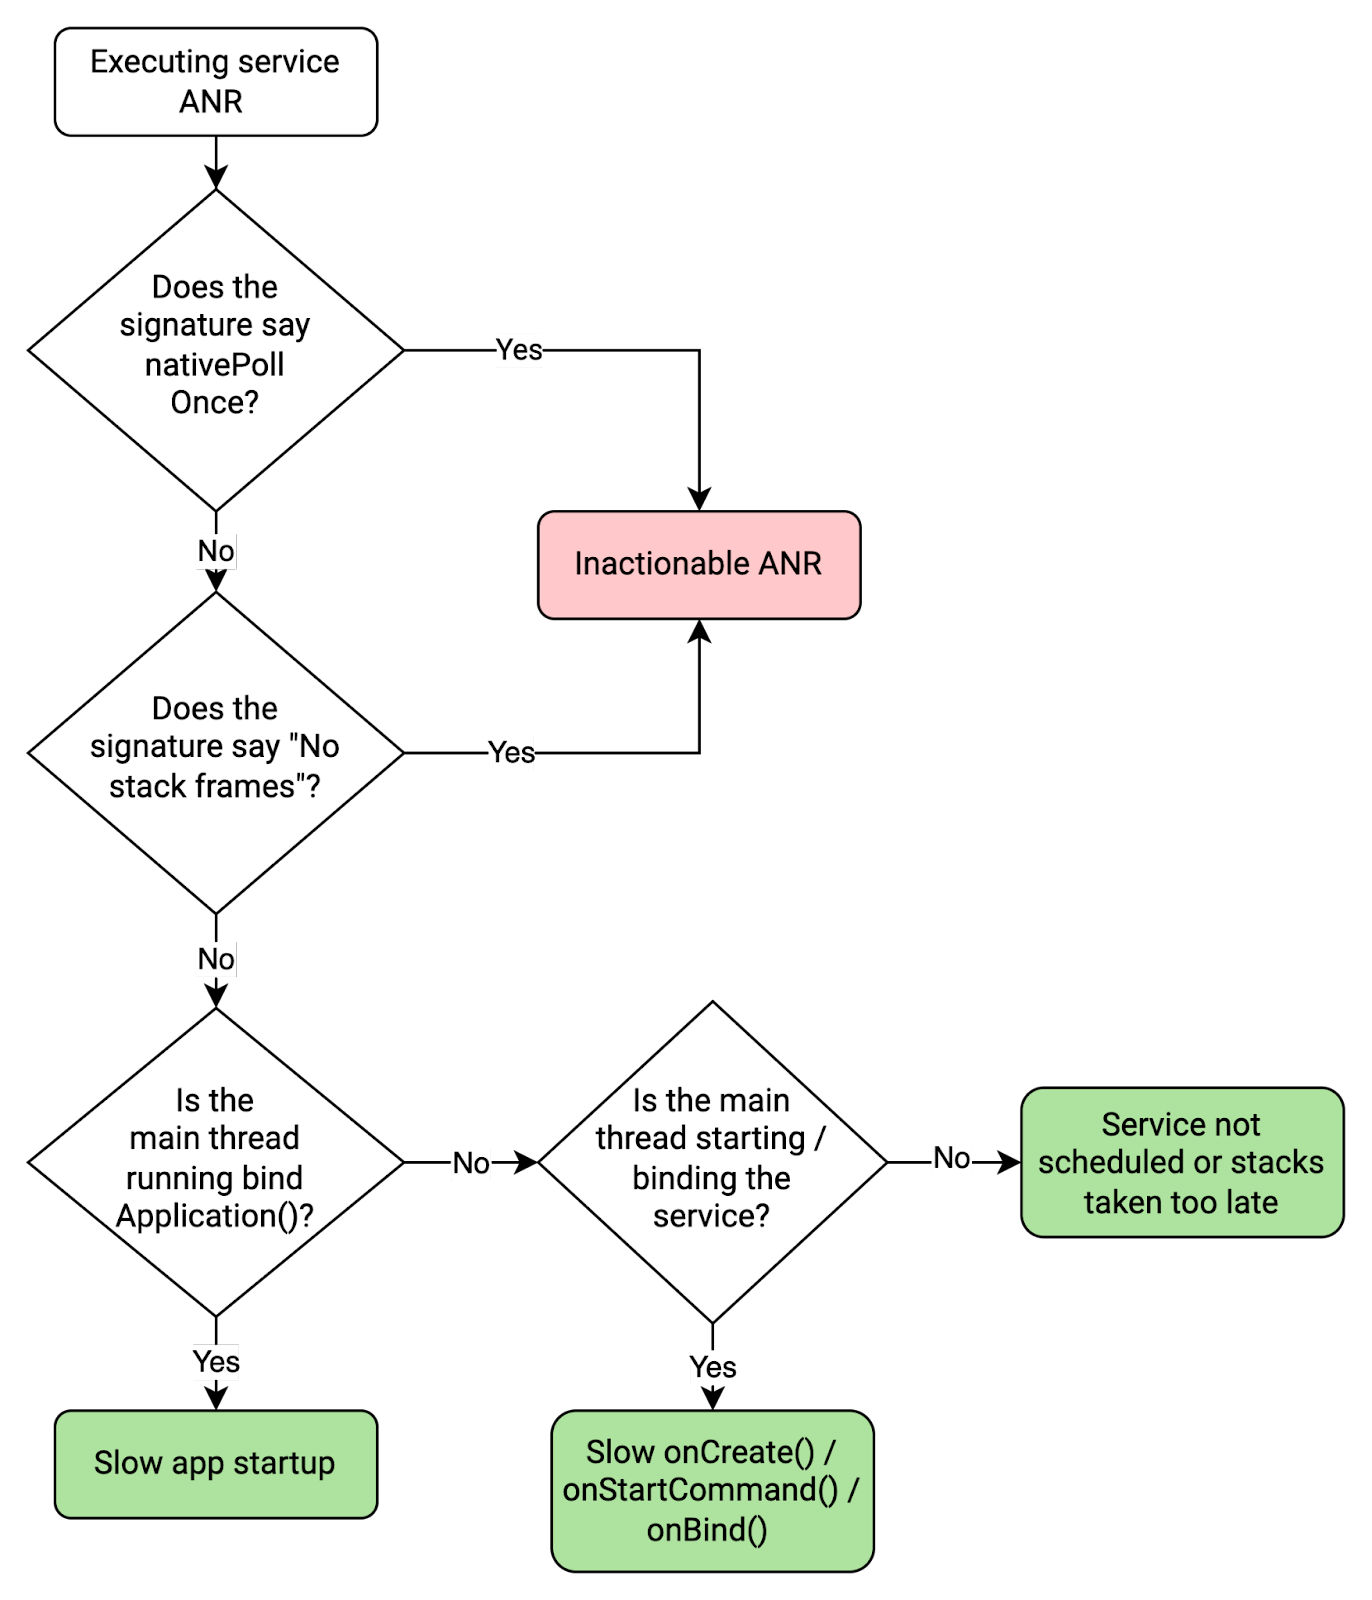
How to debug
From the cluster signature and ANR report in Google Play Console or Firebase Crashlytics, you can often determine the cause of the ANR based on what the main thread is doing.
The following flow chart describes how to debug an execute service ANR.
If you've determined that the execute service ANR is actionable, follow these steps to help resolve the issue:
Find the service component class in the ANR signature. In Google Play Console, the service component class is shown in the ANR signature. In the following example ANR details, it's
com.example.app/MyService.com.google.common.util.concurrent.Uninterruptibles.awaitUninterruptibly Executing service com.example.app/com.example.app.MyServiceDetermine whether the slow or block operation is part of app startup, the service component, or elsewhere by checking for the following important function call(s) in the main threads.
Function call(s) in main thread stacks What it means android.app.ActivityThread.handleBindApplicationApp was starting up, so the ANR was caused by slow app start. <ServiceClass>.onCreate()
[...]
android.app.ActivityThread.handleCreateService
Service was being created, so the ANR was likely caused by slow onCreate()code.<ServiceClass>.onBind()
[...]
android.app.ActivityThread.handleBindService
Service was being bound, so the ANR was likely caused by slow onBind()code.<ServiceClass>.onStartCommand()
[...]
android.app.ActivityThread.handleServiceArgs
Service was being started, so the ANR was likely caused by slow onStartCommand()code.For example, if the
onStartCommand()method in theMyServiceclass is slow, the main threads will look like this:at com.example.app.MyService.onStartCommand(FooService.java:25) at android.app.ActivityThread.handleServiceArgs(ActivityThread.java:4820) at android.app.ActivityThread.-$$Nest$mhandleServiceArgs(unavailable:0) at android.app.ActivityThread$H.handleMessage(ActivityThread.java:2289) at android.os.Handler.dispatchMessage(Handler.java:106) at android.os.Looper.loopOnce(Looper.java:205) at android.os.Looper.loop(Looper.java:294) at android.app.ActivityThread.main(ActivityThread.java:8176) at java.lang.reflect.Method.invoke(Native method:0)If you can't see any of the important function calls, there are a couple other possibilities:
- The service is running or shutting down, which means that the stacks are taken too late. In this case, you can ignore the ANR as a false positive.
- A different app component is running, such as a broadcast receiver. In this case the main thread is likely blocked in this component, preventing the service from starting.
If you do see a key function call and can determine where the ANR is happening generally, check the rest of the main thread stacks to find the slow operation and optimize it or move it off the critical path.
For more information about services, see the following pages:
Content provider not responding
A content provider ANR happens when a remote content provider takes longer than the timeout period to respond to a query, and is killed.
Default timeout period: specified by content provider using
ContentProviderClient.setDetectNotResponding. The ANR timeout period
includes the total time for a remote content provider query to run, which
includes cold-starting the remote app if it wasn't already running.
To avoid content provider ANRs, follow these best practices:
- Make sure that app startup is fast, since it's counted in the ANR timeout if the app is started to run the content provider.
- Make sure that the content provider queries are fast.
- Don't perform lots of concurrent blocking binder calls that can block all the app's binder threads.
Common causes
The following table lists common causes of content provider ANRs and suggested fixes.
| Cause | What happens | Signal | Suggested fix |
|---|---|---|---|
| Slow content provider query | The content provider takes too long to execute or is blocked. | The android.content.ContentProvider$Transport.query frame
is in the binder thread. |
Optimize content provider query. Find out what is blocking the binder thread. |
| Slow app startup | The content provider's app takes too long to start up. | The ActivityThread.handleBindApplication frame is in the
main thread. |
Optimize app startup. |
| Binder thread exhaustion—all binder threads are busy | All binder threads are busy serving other synchronous requests so the content provider binder call can't run. | The app isn't starting, all binder threads are busy, and the content provider isn't running. | Reduce load on binder threads. That is, make fewer synchronous outgoing binder calls or do less work when handling incoming calls. |
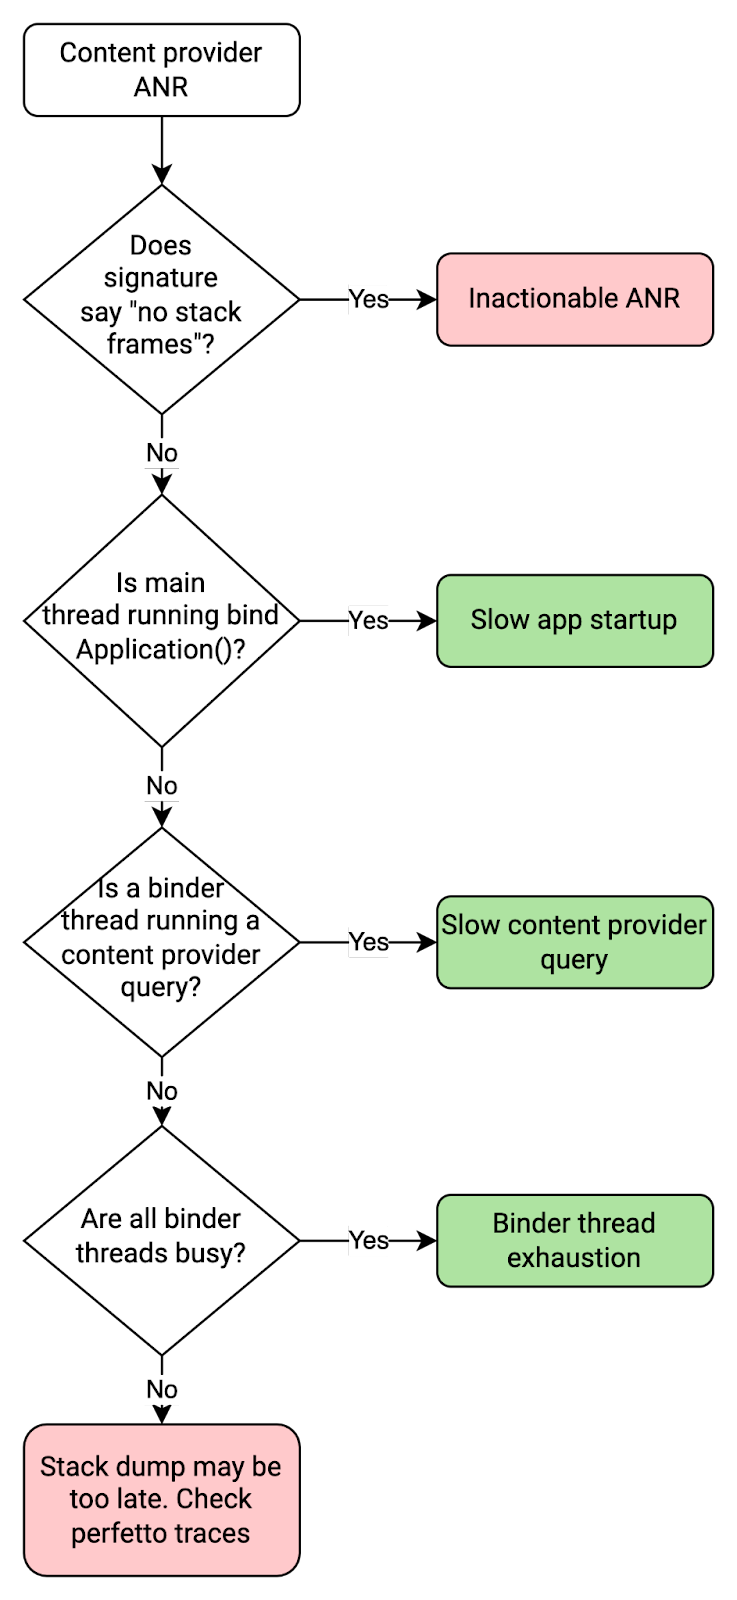
How to debug
To debug a content provider ANR using the cluster signature and ANR report in Google Play Console or Firebase Crashlytics, look at what the main thread and binder thread(s) are doing.
The following flow chart describes how to debug a content provider ANR:
The following code snippet shows what the binder thread looks like when it's blocked due to a slow content provider query. In this case, the content provider query is waiting for lock when opening a database.
binder:11300_2 (tid=13) Blocked

Waiting for osm (0x01ab5df9) held by at com.google.common.base.Suppliers$NonSerializableMemoizingSupplier.get(Suppliers:182)
at com.example.app.MyClass.blockingGetOpenDatabase(FooClass:171)
[...]
at com.example.app.MyContentProvider.query(MyContentProvider.java:915)
at android.content.ContentProvider$Transport.query(ContentProvider.java:292)
at android.content.ContentProviderNative.onTransact(ContentProviderNative.java:107)
at android.os.Binder.execTransactInternal(Binder.java:1339)
at android.os.Binder.execTransact(Binder.java:1275)
The following code snippet shows what the main thread looks like when it's blocked due to slow app startup. In this case, the app startup is slow due to lock contention during dagger initialization.
main (tid=1) Blocked

[...]
at dagger.internal.DoubleCheck.get(DoubleCheck:51)
- locked 0x0e33cd2c (a qsn)at dagger.internal.SetFactory.get(SetFactory:126)
at com.myapp.Bar_Factory.get(Bar_Factory:38)
[...]
at com.example.app.MyApplication.onCreate(DocsApplication:203)
at android.app.Instrumentation.callApplicationOnCreate(Instrumentation.java:1316)
at android.app.ActivityThread.handleBindApplication(ActivityThread.java:6991)
at android.app.ActivityThread.-$$Nest$mhandleBindApplication(unavailable:0)
at android.app.ActivityThread$H.handleMessage(ActivityThread.java:2235)
at android.os.Handler.dispatchMessage(Handler.java:106)
at android.os.Looper.loopOnce(Looper.java:205)
at android.os.Looper.loop(Looper.java:294)
at android.app.ActivityThread.main(ActivityThread.java:8170)
at java.lang.reflect.Method.invoke(Native method:0)
at com.android.internal.os.RuntimeInit$MethodAndArgsCaller.run(RuntimeInit.java:552)
at com.android.internal.os.ZygoteInit.main(ZygoteInit.java:971)
Slow job response
A slow job response ANR happens when the app takes too long to respond to
JobService.onStartJob() or JobService.onStopJob(), or takes too long to
provide a notification using JobService.setNotification(). This suggests that
the app's main thread is blocked doing something else.
If it's an issue with JobService.onStartJob() or JobService.onStopJob(),
check what's happening on the main thread. If it's an issue with
JobService.setNotification(), make sure to call it as quickly as possible.
Don't do a lot of work before providing the notification.
Mystery ANRs
Sometimes it's unclear why an ANR is occurring, or there is insufficient information to debug it in the cluster signature and ANR report. In these cases, there are still some steps you can take to determine whether the ANR is actionable.
Message queue idle or nativePollOnce
If you see the frame android.os.MessageQueue.nativePollOnce in the
stacks, it often indicates that the suspected unresponsive thread was actually
idle and waiting for looper messages. In Google Play Console, the ANR details
look like this:
Native method - android.os.MessageQueue.nativePollOnce
Executing service com.example.app/com.example.app.MyService
For example, if the main thread is idle the stacks look like this:
"main" tid=1 NativeMain threadIdle

#00  pc 0x00000000000d8b38  /apex/com.android.runtime/lib64/bionic/libc.so (__epoll_pwait+8)
#01  pc 0x0000000000019d88  /system/lib64/libutils.so (android::Looper::pollInner(int)+184)
#02  pc 0x0000000000019c68  /system/lib64/libutils.so (android::Looper::pollOnce(int, int*, int*, void**)+112)
#03  pc 0x000000000011409c  /system/lib64/libandroid_runtime.so (android::android_os_MessageQueue_nativePollOnce(_JNIEnv*, _jobject*, long, int)+44)
at android.os.MessageQueue.nativePollOnce (Native method)
at android.os.MessageQueue.next (MessageQueue.java:339)  at android.os.Looper.loop (Looper.java:208)
at android.app.ActivityThread.main (ActivityThread.java:8192)
at java.lang.reflect.Method.invoke (Native method)
at com.android.internal.os.RuntimeInit$MethodAndArgsCaller.run (RuntimeInit.java:626)
at com.android.internal.os.ZygoteInit.main (ZygoteInit.java:1015)
There are several reasons why the suspected unresponsive thread can be idle:
- Late stack dump. The thread recovered during the short period between the ANR triggering and the stacks being dumped. The latency in Pixels on Android 13 is around 100ms, but can exceed 1s. The latency in Pixels on Android 14 is usually under 10ms.
- Thread misattribution. The thread used to build the ANR signature was not the actual unresponsive thread that caused the ANR. In this case, try to determine if the ANR is one of the following types:
- System-wide issue. The process wasn't scheduled due to heavy system load or an issue in the system server.
No stack frames
Some ANR reports don't include the stacks with the ANR, which means that the stack dumping failed when generating the ANR report. There are a couple of possible reasons for missing stack frames:
- Taking the stack takes too long and times out.
- The process died or was killed before the stacks were taken.
[...]

--- CriticalEventLog ---
capacity: 20
timestamp_ms: 1666030897753
window_ms: 300000

libdebuggerd_client: failed to read status response from tombstoned: timeout reached?

----- Waiting Channels: pid 7068 at 2022-10-18 02:21:37.<US_SOCIAL_SECURITY_NUMBER>+0800 -----

[...]
ANRs without stack frames aren't actionable from the cluster signature or ANR report. To debug, look at other clusters for the app, since if an issue is large enough it'll usually have its own cluster where stack frames are present. Another option is to look at Perfetto traces.
Known issues
Keeping a timer in your app's process for the purposes of finishing broadcast handling before an ANR triggers might not work correctly because of the asynchronous way the system monitors ANRs.