קל לארגן דפים בעזרת אוספים
אפשר לשמור ולסווג תוכן על סמך ההעדפות שלך.
הקלטת פעילות המכשיר במשך תקופה קצרה נקראת מעקב אחר המערכת. מעקב אחר המערכת יוצר קובץ מעקב שאפשר להשתמש בו כדי ליצור דוח מערכת. הדוח הזה עוזר לכם לזהות את הדרך הטובה ביותר לשפר את הביצועים של האפליקציה או המשחק.
לקבלת מבוא מקיף למעקב ולפרופילים, אפשר לעיין בדף Tracing 101 במסמכי התיעוד של Perfetto.
פלטפורמת Android מספקת כמה אפשרויות שונות ללכידת עקבות:
כלי לניתוח ביצועי ה-CPU והזיכרון ב-Android Studio
כלי שורת הפקודה של Perfetto (Android מגרסה 10 ואילך)
כלי לתיעוד עקבות המערכת
כלי שורת הפקודה Systrace
הכלי ליצירת פרופילים של המעבד ב-Android Studio בודק את השימוש במעבד של האפליקציה ואת פעילות השרשור בזמן אמת בזמן האינטראקציה עם האפליקציה. אפשר גם לבדוק את הפרטים במעקב שיטות, מעקב פונקציות ומעקב מערכת שתועדו. הכלי לניתוח פרופיל הזיכרון מספק סקירה כללית של השימוש בזיכרון ביחס לאירועי מגע, לשינויים ב-Activity ולאירועים של איסוף אשפה.
Perfetto הוא כלי למעקב בכל הפלטפורמה שהוצג ב-Android 10. זהו פרויקט מתוחכם של קוד פתוח למעקב ב-Android, ב-Linux וב-Chrome. הוא מציע קבוצת-על של מקורות נתונים בהשוואה ל-Systrace, ומאפשר לכם להקליט עקבות ארוכים באופן שרירותי בזרם בינארי של מאגר פרוטוקולים. אפשר לפתוח את העקבות האלה בממשק המשתמש של Perfetto.
הכלי System tracing הוא כלי של Android ששומר את הפעילות במכשיר בקובץ מעקב. במכשיר עם Android 10 (API ברמה 29) ומעלה, קובצי המעקב נשמרים בפורמט Perfetto, כמו שמוצג בהמשך המסמך הזה. במכשיר עם גרסה קודמת של Android, קובצי המעקב נשמרים בפורמט Systrace.
Systrace הוא כלי משורת הפקודה שסופק על ידי פלטפורמה מדור קודם, שמתעד את פעילות המכשיר לפרק זמן קצר בקובץ טקסט דחוס. הכלי יוצר דוח שמשלב נתונים מליבת Android, כמו מתזמן המעבד, פעילות הדיסק ושרשורי האפליקציה. הכלי Systrace פועל בכל הגרסאות של פלטפורמת Android, אבל מומלץ להשתמש ב-Perfetto במכשירים עם Android 10 ומעלה.
איור 1. תצוגת מעקב לדוגמה ב-Perfetto, שבה מוצגות כ-20 שניות של אינטראקציה עם אפליקציה.
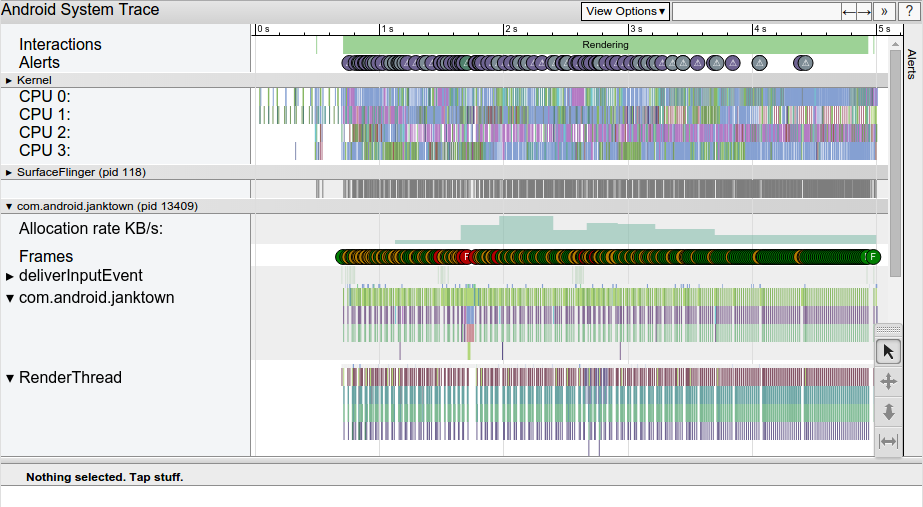
איור 2. דוגמה לדוח HTML של Systrace, שבו מוצגות חמש שניות של אינטראקציה עם אפליקציה.
שני הדוחות מספקים תמונה כוללת של תהליכי המערכת במכשיר עם Android במהלך תקופה מסוימת. הדוח גם בודק את מידע המעקב שנאסף כדי להדגיש בעיות שהוא מזהה, כמו תנועה לא חלקה בממשק המשתמש או צריכת חשמל גבוהה.
יש יכולת פעולה הדדית בין Perfetto לבין Systrace:
פותחים את קובצי Perfetto ואת קובצי Systrace בממשק המשתמש של Perfetto. כדי לפתוח קובצי Systrace באמצעות כלי הצפייה הקודם ב-Systrace בממשק המשתמש של Perfetto, לוחצים על הקישור Open with legacy UI (פתיחה באמצעות ממשק משתמש מדור קודם).
כלי Perfetto לצפייה בנתוני מעקב מבוסס-אינטרנט פותח נתוני מעקב של Perfetto ומציג דוח מלא. אפשר גם לפתוח עקבות של Systrace בכלי הזה באמצעות האפשרות של ממשק המשתמש מדור קודם.
הסבר על האופן שבו אפשר להחיל תוויות מותאמות אישית על קטעים ספציפיים בקוד, כדי להקל על ניתוח שורש הבעיה ב-Systrace או ב-Perfetto.
דוגמאות התוכן והקוד שבדף הזה כפופות לרישיונות המפורטים בקטע רישיון לתוכן. Java ו-OpenJDK הם סימנים מסחריים או סימנים מסחריים רשומים של חברת Oracle ו/או של השותפים העצמאיים שלה.
עדכון אחרון: 2025-08-21 (שעון UTC).
[[["התוכן קל להבנה","easyToUnderstand","thumb-up"],["התוכן עזר לי לפתור בעיה","solvedMyProblem","thumb-up"],["סיבה אחרת","otherUp","thumb-up"]],[["חסרים לי מידע או פרטים","missingTheInformationINeed","thumb-down"],["התוכן מורכב מדי או עם יותר מדי שלבים","tooComplicatedTooManySteps","thumb-down"],["התוכן לא עדכני","outOfDate","thumb-down"],["בעיה בתרגום","translationIssue","thumb-down"],["בעיה בדוגמאות/בקוד","samplesCodeIssue","thumb-down"],["סיבה אחרת","otherDown","thumb-down"]],["עדכון אחרון: 2025-08-21 (שעון UTC)."],[],[],null,["# Overview of system tracing\n\nRecording device activity over a short period of time is known as *system\ntracing*. System tracing produces a trace file that you can use to generate a\nsystem report. This report helps you identify how best to improve your app or\ngame's performance.\n\nFor a comprehensive introduction to tracing and profiling, see the\n[Tracing 101](https://perfetto.dev/docs/tracing-101) page in the\nPerfetto documentation.\n\nThe Android platform provides several different options for capturing traces:\n\n- Android Studio CPU and memory profiler\n- Perfetto command-line tool (Android 10 and higher)\n- System tracing utility\n- Systrace command-line tool\n\nThe Android Studio CPU profiler inspects your app's CPU usage and thread\nactivity in real time while you interact with your app. You can also inspect the\ndetails in recorded method traces, function traces, and system traces. The\nmemory profiler gives an overview of memory usage in relation to touch events,\n[`Activity`](/reference/android/app/Activity) changes, and garbage collection\nevents.\n\nPerfetto is the platform-wide tracing tool introduced in\nAndroid 10. It is a sophisticated open source tracing project for\nAndroid, Linux, and Chrome. It offers a superset of data sources compared to\nSystrace and lets you record arbitrarily long traces in a protocol buffer binary\nstream. You can open these traces in the [Perfetto\nUI](https://ui.perfetto.dev/#!/).\n\nThe System tracing utility is an Android tool that saves device activity to a\ntrace file. On a device running Android 10 (API level 29) or higher, trace files\nare saved in Perfetto format, as shown later in this document. On a device\nrunning an earlier version of Android, trace files are saved in the Systrace\nformat.\n\nSystrace is a legacy platform-provided command-line tool that records device\nactivity over a short period of time in a compressed text file. The tool\nproduces a report that combines data from the Android kernel, such as the CPU\nscheduler, disk activity, and app threads. Systrace works on all Android\nplatform versions, but we recommend Perfetto for devices running Android 10 and\nhigher.\n**Figure 1.** A sample Perfetto trace view, which shows about 20 seconds\nof interaction with an app.\n**Figure 2.** A sample Systrace HTML report, which shows five seconds of\ninteraction with an app.\n\nBoth reports provide an overall picture of an Android-powered device's system\nprocesses for a given period of time. The report also inspects the captured\ntracing information to highlight problems that it observes, such as UI jank or\nhigh power consumption.\n\nPerfetto and Systrace are interoperable:\n\n- Open both Perfetto files and Systrace files in the Perfetto UI. Open Systrace files with the legacy Systrace viewer in the Perfetto UI by clicking the **Open with legacy UI** link.\n- [Convert a Perfetto trace to the legacy Systrace text\n format](https://docs.perfetto.dev/#/traceconv.md) using the `traceconv` tool.\n\n| **Note:** Systrace and Perfetto don't collect detailed information about code execution within your app process. For more detailed information about which methods your app is executing and how many CPU resources it's using, use the [CPU profiler](/studio/profile/cpu-profiler) in Android Studio.\n\nSystem tracing guides\n---------------------\n\nTo learn more about system tracing tools, see the following guides:\n\n[**Inspect CPU activity with CPU Profiler**](/studio/profile/cpu-profiler)\n: Shows how to profile your app's CPU usage and thread activity in Android\n Studio.\n\n[**Capture a system trace on a device**](/topic/performance/tracing/on-device)\n: Explains how to capture a system trace directly on any device running\n Android 9 (API level 28) or higher.\n\n[**Capture a system trace on the command line**](/topic/performance/tracing/command-line)\n: Defines the different options and flags that you can pass into the\n command-line interface for Systrace.\n\n[**Run Perfetto using adb**](/studio/command-line/perfetto)\n: Describes how to run the `perfetto` command-line tool to capture traces.\n\n[**Quickstart: Record traces on Android**](https://perfetto.dev/#/running.md)\n: External documentation that describes how to build and run the `perfetto`\n command-line tool to capture traces.\n\n[**Quickstart: Record traces on Android**](https://perfetto.dev/#/running.md)\n: The Perfetto web-based trace viewer opens Perfetto traces and displays a\n complete report. You can also open Systrace traces in this viewer using the\n legacy UI option.\n\n[**Navigate a Systrace report**](/topic/performance/tracing/navigate-report)\n: Lists the elements of a typical report, presents keyboard shortcuts for\n navigating through the report, and describes how to identify types of\n performance problems.\n\n[**Define custom events**](/topic/performance/tracing/custom-events)\n: Describes how you can apply custom labels to specific sections of your code,\n allowing for easier root-cause analysis in Systrace or Perfetto."]]