Traceview を使用してトレースログを検査する
コレクションでコンテンツを整理
必要に応じて、コンテンツの保存と分類を行います。
Traceview のサポートは終了しました。Android Studio 3.2 以降を使用している場合は、代わりに CPU Profiler を使用することで、Debug
クラスを使用したアプリのインストルメント化によってキャプチャした .trace
ファイルの検査、新しいメソッド トレースの記録、.trace
ファイルの保存、アプリプロセスのリアルタイム CPU 使用率の検査を行うことができます。
Traceview は、トレースログを視覚的に表示できるツールです。Debug
クラスを使用してコードをインストルメント化することによって、ログを生成できます。トレースデータのロギングを開始する場所や停止する場所をコード内で正確に指定できるため、このトレース方法は非常に正確です。トレースログをまだ生成しておらず、接続したデバイスからローカルマシンに保存していない場合は、アプリをインストルメント化してトレースログを生成するをご覧ください。Traceview を使用したログの検査は、アプリのデバッグやパフォーマンスのプロファイリングに役立ちます。
ヒント: コマンドラインから dmtracedump
を使用すると、トレースログ ファイルのグラフィカルなコールスタック図を生成できます。
トレースログ(Debug
クラスを使用してアプリをインストルメント化することによって記録したログ)を表示する必要がない場合は、Android Studio 3.0 以降に含まれている CPU Profiler を使用して、アプリのスレッドを検査し、メソッド トレースを記録できます。
Traceview を使用してトレースログを開く
Android Studio から Traceview を使用してトレースログを開く手順は次のとおりです。
- Android Device Monitor を起動します。
- Android Device Monitor で、[File] > [Open File] を選択します。
- 検査する
.trace
ファイルに移動します。
- [Open] をクリックします。
注: コード圧縮を有効にしてビルドされたアプリ(リリースビルドなど)のトレースログを表示しようとすると、一部のメソッドとメンバー名が難読化される場合があります。ProGuard の mapping.txt
ファイルを使用すると、難読化されていない元の名前がわかります。このファイルの詳細については、難読化されたスタック トレースのデコードをご覧ください。
注: コマンドラインから traceview
を実行する方法は、サポートが終了しました。
Traceview の概要
トレースログを開くと、Traceview は次の 2 つのパネルを使用してログデータを表示します。
以下のセクションでは、各 Traceview 出力パネルについて詳細に説明します。
タイムライン パネル
タイムライン パネルの拡大図を図 1 に示します。各スレッドの実行状況が、それぞれ個別の行に表示されます。経過時間は左から右に増加しています。各メソッドは、さまざまな色で彩色されます。最初の行の下にある細い行は、選択したメソッドの子(エントリから終了まで)を示しています。
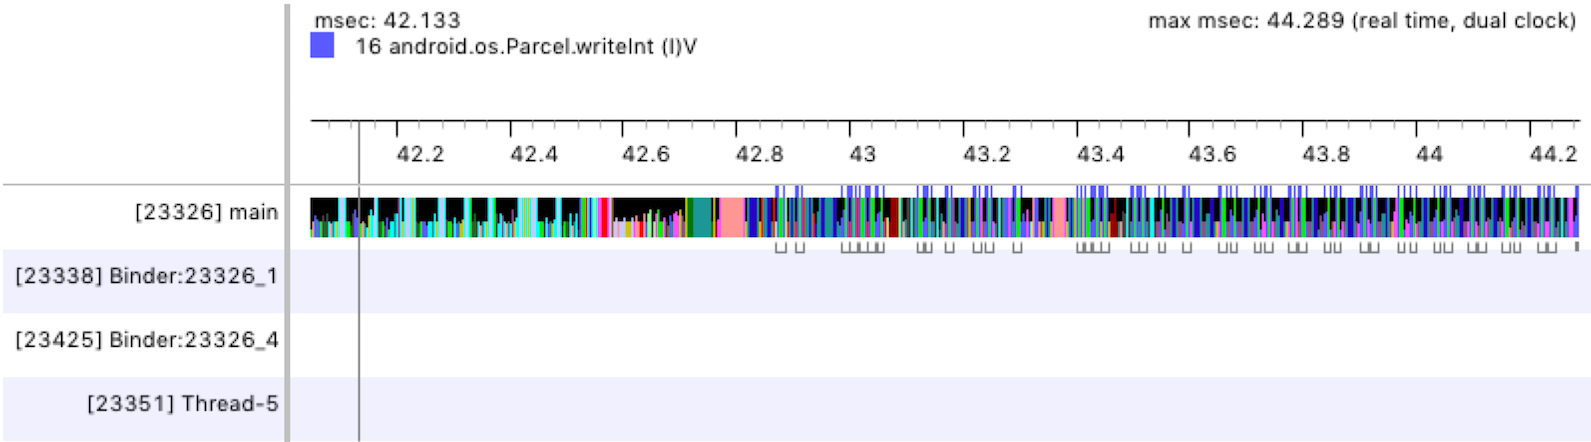
図 1. Traceview タイムライン パネル
プロファイル パネル
プロファイル パネルには、トレースログの期間中にシステムが実行した各メソッドのリストと、各メソッドの実行にかかった時間が表示されます(図 2 を参照)。別のメソッドを呼び出すメソッドは「親」と呼ばれ、親が呼び出すメソッドは「子」と呼ばれます。メソッドをクリックして選択すると、親と子が 2 つの個別ノードの下に表示されます。
表には、各メソッド(最上位ノード)の包括的時間と排他的時間(単位: ミリ秒)、ならびに合計時間の割合が表示されます。「排他的時間」とは、メソッドの独自コードの実行に費やされた時間のことを指し、「包括的時間」とは、メソッドの独自コードの実行に費やされた時間と子の実行に費やされた時間とを総計した時間のことを指します。また、CPU 時間と実時間を基準とするタイミング情報もレポートされます。「CPU 時間」は、スレッドがアクティブに CPU 時間を使用している時間だけを対象とし、「実時間」は、スレッドがアクティブであるかスリープ状態であるかに関係なく、アプリがメソッドを入力してからそのメソッドを終了するまでの絶対的タイミング情報を提供します。
プロファイル パネルの各最上位ノードを対象として、表内の [Calls + Rec, Calls/Total] 列(図 2 には表示されていません)は、メソッドの呼び出し数と再帰呼び出しの数をレポートします。また、親メソッドや子メソッドの場合、この列には、対象メソッドが最上位ノード内のメソッドの子または親となった状況下での呼び出し数が表示されます。
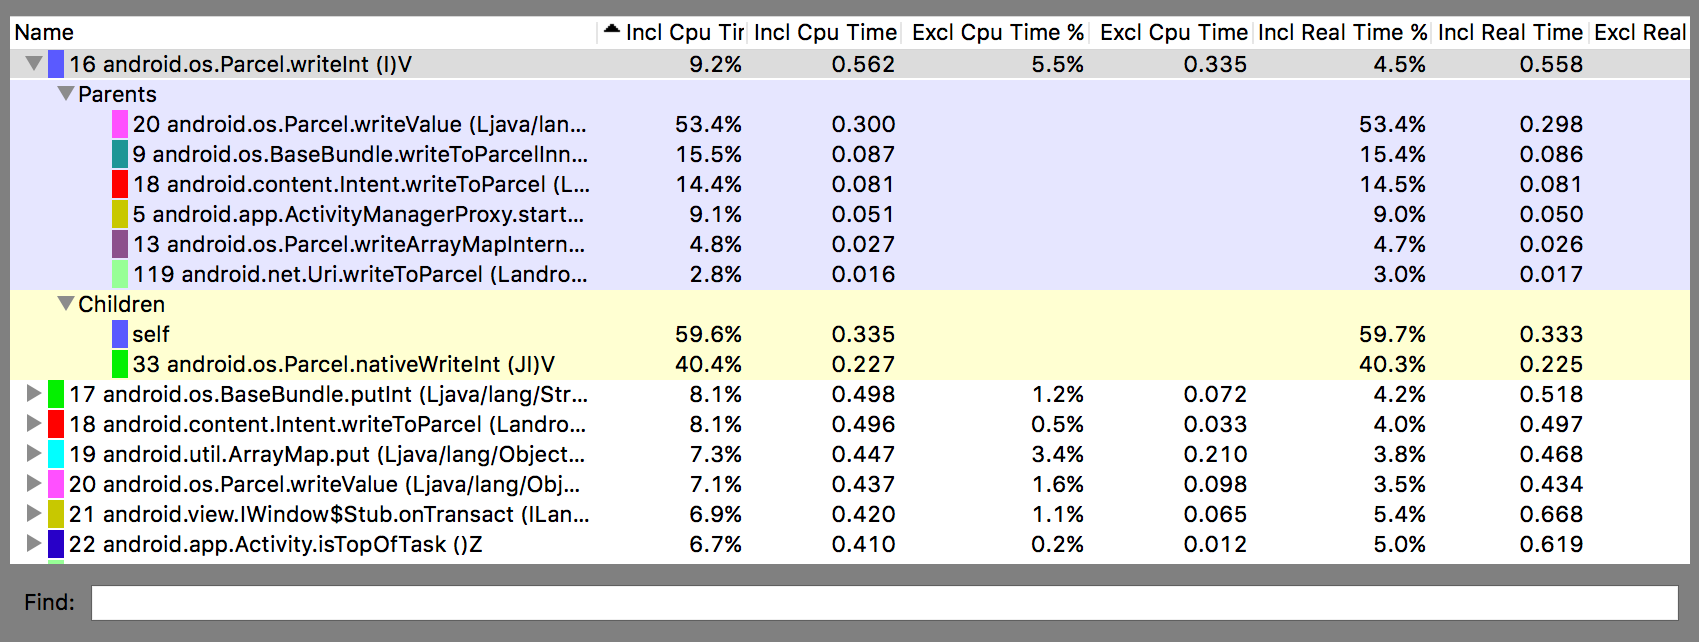
図 2. Traceview プロファイル パネル
Traceview に関する既知の問題
Traceview のロギングではスレッドの処理が厳密ではないため、次の問題が発生します。
- プロファイリング中にスレッドが終了した場合、スレッド名は出力されません(Android 5.1 以降は修正済み)。
- VM はスレッド ID を再利用します。スレッドが停止し、別のスレッドが開始した場合に、同じ ID を取得することがあります。
このページのコンテンツやコードサンプルは、コンテンツ ライセンスに記載のライセンスに従います。Java および OpenJDK は Oracle および関連会社の商標または登録商標です。
最終更新日 2025-07-27 UTC。
[[["わかりやすい","easyToUnderstand","thumb-up"],["問題の解決に役立った","solvedMyProblem","thumb-up"],["その他","otherUp","thumb-up"]],[["必要な情報がない","missingTheInformationINeed","thumb-down"],["複雑すぎる / 手順が多すぎる","tooComplicatedTooManySteps","thumb-down"],["最新ではない","outOfDate","thumb-down"],["翻訳に関する問題","translationIssue","thumb-down"],["サンプル / コードに問題がある","samplesCodeIssue","thumb-down"],["その他","otherDown","thumb-down"]],["最終更新日 2025-07-27 UTC。"],[],[],null,["# Inspect trace logs with Traceview\n\n**Traceview is deprecated.** If you're using Android\nStudio 3.2 or later, you should instead use\n[**CPU Profiler**](/studio/profile/cpu-profiler) to inspect\n`.trace` files captured by\n[instrumenting your app](/studio/profile/generate-trace-logs)\nwith the [`Debug`](/reference/android/os/Debug)\nclass, record new method traces, save `.trace` files, and inspect\nreal-time CPU usage of your app's processes.\n\nTraceview is a tool that provides a graphical representations of\ntrace logs. You can generate the logs by instrumenting your code with the\n[`Debug`](/reference/android/os/Debug) class. This method of tracing is\nvery precise because you can specify exactly where in the code you want to start\nand stop logging trace data. If you haven't yet generated these trace logs and\nsaved them from your connected device to your local machine, go to [Generate\ntrace logs by instrumenting your app](/studio/profile/generate-trace-logs).\nInspecting these logs using Traceview helps you debug your app and\nprofile its performance.\n\n\n**Tip:** You can [use\n`dmtracedump`](/studio/command-line/dmtracedump) from the command-line to generate a graphical\ncall-stack diagrams of your trace log files.\n\nIf you don't need to view trace logs that you have recorded by instrumenting\nyour app with the [Debug](/reference/android/os/Debug)\nclass, you can [use the CPU profiler](/studio/profile/cpu-profiler)\nincluded in Android Studio 3.0 and higher to inspect your app's threads and record\nmethod traces.\n\nOpen a trace log using Traceview\n--------------------------------\n\nTo open a trace log with Traceview from Android Studio, proceed as follows:\n\n1. Start [Android Device Monitor](/studio/profile/monitor).\n2. In the Android Device Monitor, select **File \\\u003e Open File**.\n3. Navigate to the `.trace` file you want to inspect.\n4. Click **Open**.\n\n\u003cbr /\u003e\n\n**Note:** If you are trying to view the trace logs\nof an app that is built with code shrinking enabled (such as a release build),\nsome method and member names might be obfuscated. You can use the ProGuard\n`mapping.txt` file to figure out the original unobfuscated names.\nFor more information on this file, see\n[Decode an obfuscated\nstack trace](/studio/build/shrink-code#decode-stack-trace).\n\n**Note:** Running `traceview` from the\ncommand line has been deprecated.\n\nTraceview overview\n------------------\n\nAfter opening a trace log, Traceview displays log data using the following two\npanes:\n\n- A [timeline pane](#timeline_pane) that describes when each thread enters and exits a method\n- A [profile pane](#profile_pane) that summarizes the execution of each thread over the period of the trace log\n\nThe sections below provide addition information about the traceview output panes.\n\n### Timeline pane\n\nFigure 1 shows a close up of the timeline pane. Each thread's execution is\nshown in its own row, with the elapsed time increasing towards the right.\nEach method is shown in varying colors. The thin lines underneath the first\nrow show the children (from entry to exit) of the selected method.\n\n\n**Figure 1.**\nThe Traceview timeline pane.\n\n\u003cbr /\u003e\n\n### Profile pane\n\nAs shown in figure 2, the profile pane provides a list of each method the system\nexecuted over the period of the trace log and the time spent executing those\nmethods. A method that calls another method is referred to as the *parent* , and\nmethods that a parent calls are referred to as its *children*. When you\nselect a method by clicking on it, it displays both its parents and its children\nunder two separate nodes.\n\nFor each method (top-level node), the table shows both its inclusive and\nexclusive times (in milliseconds) as well as the percentage of the total time.\n*Exclusive time* is the time spent executing the method's own code, while\n*inclusive time* is the time spent executing the method's own code plus the time\nspent executing its children. Timing information is also reported in terms of\nCPU time and real time. *CPU time* considers only the time that the thread is\nactively using CPU time, and *real time* provides absolute timing information\nfrom the moment your app enters a method to when it exits that method---regardless\nof whether the thread is active or sleeping.\n\nFor each top-level node in the profile pane, the **Calls + Rec, Calls/Total**\ncolumn in the table (not shown in figure 2) reports the number of calls to the\nmethod and the number of recursive calls. Or, for parent and child methods, this\ncolumn shows the number of calls in which the method was a child or parent of\nthe method in the top-level node.\n\n\n**Figure 2.** The Traceview profile pane.\n\n\u003cbr /\u003e\n\nTraceview known issues\n----------------------\n\nTraceview logging does not handle threads well, resulting in the following\nissues:\n\n- If a thread exits during profiling, the thread name is not emitted (fixed in Android 5.1 and later);\n- The VM reuses thread IDs. If a thread stops and another starts, they may get the same ID."]]