使用 Traceview 檢查追蹤記錄
透過集合功能整理內容
你可以依據偏好儲存及分類內容。
Traceview 已淘汰。如果使用 Android
Studio 3.2 以上版本,建議您改用 CPU 分析器以使用 Debug
類別、方法追蹤記錄、儲存 .trace
檔案,透過檢測應用程式的方式檢查 .trace
檔案,並檢查應用程式處理程序的及時 CPU 使用量。
Traceview 是可以透過圖形呈現方式提供追蹤記錄的工具。您可以使用 Debug
類別檢測程式碼以產生記錄檔。此追蹤方法非常準確,因為您可以指定程式碼中要開始及停止記錄追蹤資料的確切位置。如果您尚未產生這些追蹤記錄,並將這些記錄從已連結的裝置儲存至本機電腦,請參閱「檢測應用程式以產生追蹤記錄」。使用 Traceview 檢查這些記錄檔,可協助您為應用程式偵錯並分析其效能。
提示:您可以使用 dmtracedump
從指令列產生追蹤記錄檔的圖形呼叫堆疊圖表。
如果您不需查看使用 Debug
類別檢測應用程式所記錄的追蹤記錄,則可使用 Android Studio 3.0 以上版本隨附的 CPU 分析器檢查應用程式的執行緒和記錄方法追蹤記錄。
使用 Traceview 開啟追蹤記錄
如要使用 Traceview 開啟 Android Studio 的追蹤記錄,請按照下列步驟操作:
- 啟動 Android 裝置監視程式。
- 在 Android Device Monitor 中,依序選取「File」>「Open File」。
- 前往你要檢查的
.trace
檔案。
- 按一下「Open」。
注意:如果您要查看使用已啟用程式碼縮減功能 (例如:發布子版本) 建構的應用程式追蹤記錄,某些方法和成員名稱可能會模糊化處理。您可以使用 ProGuard mapping.txt
檔案找出原始未經過模糊化處理的名稱。如要進一步瞭解此檔案,請參閱「解碼模糊化的堆疊追蹤」。
注意:從指令列執行 traceview
的方式已淘汰。
Traceview 總覽
開啟追蹤記錄後,Traceview 會使用以列兩個窗格顯示記錄檔資料:
- 時間軸窗格,說明每個執行緒進入及結束方法的時間
- 設定檔窗格,概略說明各執行緒在追蹤記錄期間的執行作業
以下各節提供 Traceview 輸出窗格的額外資訊。
時間軸窗格
圖 1 顯示時間軸窗格的特寫。每個執行緒的執行作業都會在專屬的列中顯示,而經過的時間會向右逐漸增加。每個方法會以不同的顏色顯示。第一列下方的細線代表選取方法的子項 (從進入到結束)。
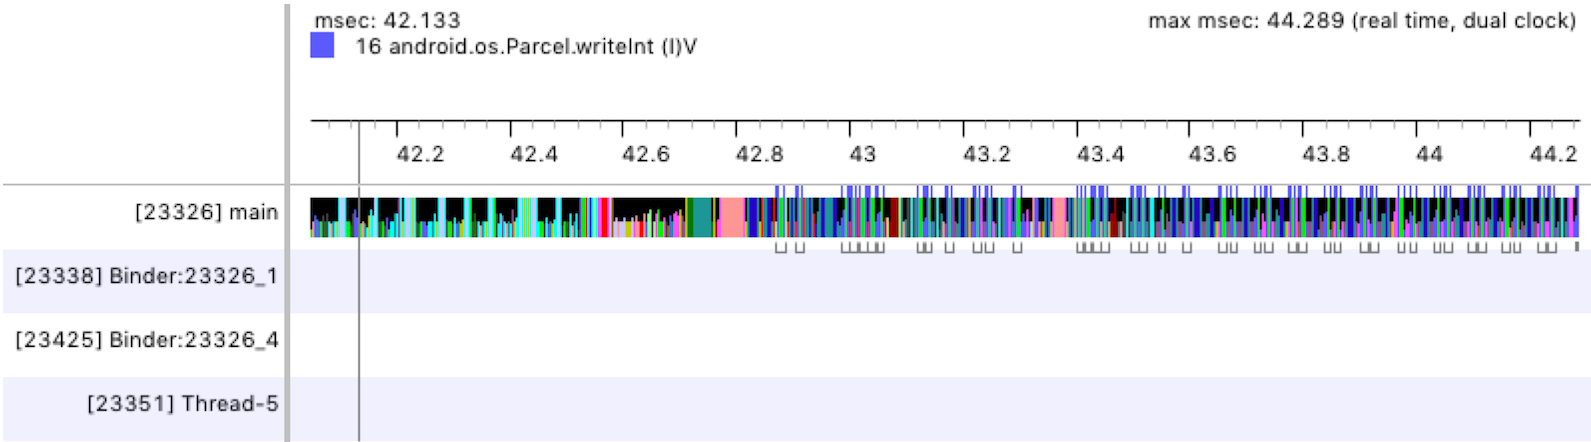
圖 1:Traceview 時間軸窗格。
設定檔窗格
如圖 2 所示,設定檔窗格會提供系統在追蹤記錄期間執行的各個方法,以及這些方法的執行時間。呼叫其他方法的方法稱為「父項」,而父項呼叫的方法稱為「子項」。按一下以選取方法時,畫面就會兩個分隔的節點下方同時顯示父項及其子項。
對於各個方法 (頂層節點),此表格會同時顯示其內含及專屬時間 (以毫秒為單位),以及總時間的百分比。「專屬時間」是執行方法本身的程式碼所耗費的時間,而「內含時間」則是指執行方法本身的程式碼,再加上執行其子項所耗費的時間。時間碼資訊也會按照 CPU 時間和即時時間回報。「CPU 時間」只會計算將執行緒主動使用 CPU 時間的時間,而「即時時間」則會提供從應用程式進入方法到離開該方法的絕對時間碼資訊 (不論執行緒是否啟用或處於休眠狀態)。
對於設定檔窗格中每個頂層節點,表格中的「Calls + Rec, Calls/Total」(呼叫 + Rec,呼叫/總數) 欄 (未於圖 2 顯示) 會回報方法呼叫的次數和週期性呼叫的次數。或者,在父項和子項方法中,此欄會顯示在頂層節點中方法為子項或父項方法的呼叫次數。
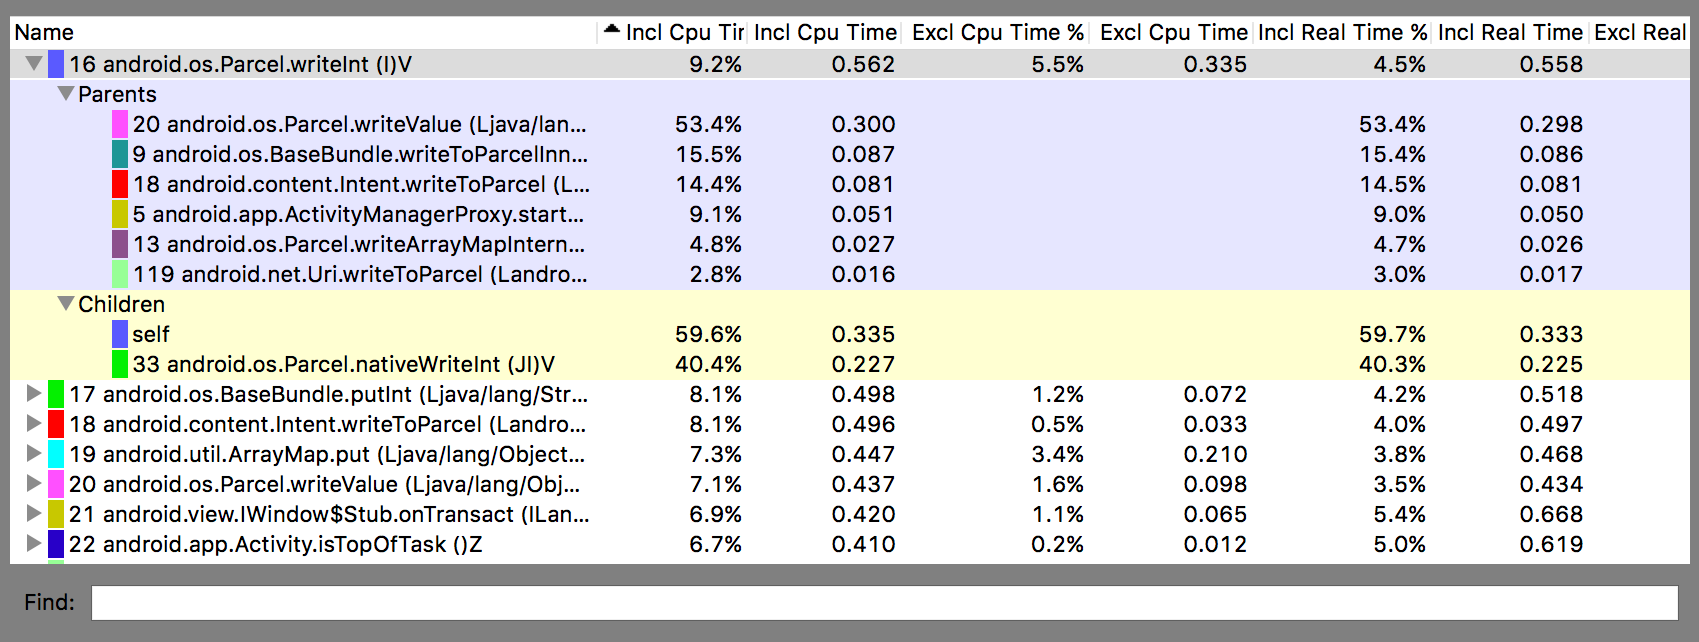
圖 2. Traceview 設定檔窗格。
Traceview 已知問題
Traceview 記錄無法妥善處理執行緒,因此導致出現以下問題:
- 如果執行緒在剖析期間結束,就不會傳送執行緒名稱 (已在 Android 5.1 以上版本中修正);
- VM 會重複使用執行緒 ID。如果執行緒停止,而另一個執行緒開始,可能會取得相同的 ID。
這個頁面中的內容和程式碼範例均受《內容授權》中的授權所規範。Java 與 OpenJDK 是 Oracle 和/或其關係企業的商標或註冊商標。
上次更新時間:2025-07-27 (世界標準時間)。
[[["容易理解","easyToUnderstand","thumb-up"],["確實解決了我的問題","solvedMyProblem","thumb-up"],["其他","otherUp","thumb-up"]],[["缺少我需要的資訊","missingTheInformationINeed","thumb-down"],["過於複雜/步驟過多","tooComplicatedTooManySteps","thumb-down"],["過時","outOfDate","thumb-down"],["翻譯問題","translationIssue","thumb-down"],["示例/程式碼問題","samplesCodeIssue","thumb-down"],["其他","otherDown","thumb-down"]],["上次更新時間:2025-07-27 (世界標準時間)。"],[],[],null,["# Inspect trace logs with Traceview\n\n**Traceview is deprecated.** If you're using Android\nStudio 3.2 or later, you should instead use\n[**CPU Profiler**](/studio/profile/cpu-profiler) to inspect\n`.trace` files captured by\n[instrumenting your app](/studio/profile/generate-trace-logs)\nwith the [`Debug`](/reference/android/os/Debug)\nclass, record new method traces, save `.trace` files, and inspect\nreal-time CPU usage of your app's processes.\n\nTraceview is a tool that provides a graphical representations of\ntrace logs. You can generate the logs by instrumenting your code with the\n[`Debug`](/reference/android/os/Debug) class. This method of tracing is\nvery precise because you can specify exactly where in the code you want to start\nand stop logging trace data. If you haven't yet generated these trace logs and\nsaved them from your connected device to your local machine, go to [Generate\ntrace logs by instrumenting your app](/studio/profile/generate-trace-logs).\nInspecting these logs using Traceview helps you debug your app and\nprofile its performance.\n\n\n**Tip:** You can [use\n`dmtracedump`](/studio/command-line/dmtracedump) from the command-line to generate a graphical\ncall-stack diagrams of your trace log files.\n\nIf you don't need to view trace logs that you have recorded by instrumenting\nyour app with the [Debug](/reference/android/os/Debug)\nclass, you can [use the CPU profiler](/studio/profile/cpu-profiler)\nincluded in Android Studio 3.0 and higher to inspect your app's threads and record\nmethod traces.\n\nOpen a trace log using Traceview\n--------------------------------\n\nTo open a trace log with Traceview from Android Studio, proceed as follows:\n\n1. Start [Android Device Monitor](/studio/profile/monitor).\n2. In the Android Device Monitor, select **File \\\u003e Open File**.\n3. Navigate to the `.trace` file you want to inspect.\n4. Click **Open**.\n\n\u003cbr /\u003e\n\n**Note:** If you are trying to view the trace logs\nof an app that is built with code shrinking enabled (such as a release build),\nsome method and member names might be obfuscated. You can use the ProGuard\n`mapping.txt` file to figure out the original unobfuscated names.\nFor more information on this file, see\n[Decode an obfuscated\nstack trace](/studio/build/shrink-code#decode-stack-trace).\n\n**Note:** Running `traceview` from the\ncommand line has been deprecated.\n\nTraceview overview\n------------------\n\nAfter opening a trace log, Traceview displays log data using the following two\npanes:\n\n- A [timeline pane](#timeline_pane) that describes when each thread enters and exits a method\n- A [profile pane](#profile_pane) that summarizes the execution of each thread over the period of the trace log\n\nThe sections below provide addition information about the traceview output panes.\n\n### Timeline pane\n\nFigure 1 shows a close up of the timeline pane. Each thread's execution is\nshown in its own row, with the elapsed time increasing towards the right.\nEach method is shown in varying colors. The thin lines underneath the first\nrow show the children (from entry to exit) of the selected method.\n\n\n**Figure 1.**\nThe Traceview timeline pane.\n\n\u003cbr /\u003e\n\n### Profile pane\n\nAs shown in figure 2, the profile pane provides a list of each method the system\nexecuted over the period of the trace log and the time spent executing those\nmethods. A method that calls another method is referred to as the *parent* , and\nmethods that a parent calls are referred to as its *children*. When you\nselect a method by clicking on it, it displays both its parents and its children\nunder two separate nodes.\n\nFor each method (top-level node), the table shows both its inclusive and\nexclusive times (in milliseconds) as well as the percentage of the total time.\n*Exclusive time* is the time spent executing the method's own code, while\n*inclusive time* is the time spent executing the method's own code plus the time\nspent executing its children. Timing information is also reported in terms of\nCPU time and real time. *CPU time* considers only the time that the thread is\nactively using CPU time, and *real time* provides absolute timing information\nfrom the moment your app enters a method to when it exits that method---regardless\nof whether the thread is active or sleeping.\n\nFor each top-level node in the profile pane, the **Calls + Rec, Calls/Total**\ncolumn in the table (not shown in figure 2) reports the number of calls to the\nmethod and the number of recursive calls. Or, for parent and child methods, this\ncolumn shows the number of calls in which the method was a child or parent of\nthe method in the top-level node.\n\n\n**Figure 2.** The Traceview profile pane.\n\n\u003cbr /\u003e\n\nTraceview known issues\n----------------------\n\nTraceview logging does not handle threads well, resulting in the following\nissues:\n\n- If a thread exits during profiling, the thread name is not emitted (fixed in Android 5.1 and later);\n- The VM reuses thread IDs. If a thread stops and another starts, they may get the same ID."]]