단기간 동안의 기기 활동을 기록하는 것을 시스템 추적이라고 합니다. 시스템 추적을 실행하면 시스템 보고서를 생성하는 데 사용할 수 있는 트레이스 파일이 생성됩니다. 이 보고서에서는 앱 또는 게임의 성능을 가장 효과적으로 향상하는 방법을 확인할 수 있습니다.
추적 및 프로파일링에 관한 포괄적인 소개는 Perfetto 문서의 Tracing 101 페이지를 참고하세요.
Android 플랫폼은 트레이스를 캡처하는 몇 가지 옵션을 제공합니다.
Android 스튜디오 CPU 및 메모리 프로파일러
Perfetto 명령줄 도구(Android 10 이상)
시스템 추적 유틸리티
Systrace 명령줄 도구
Android 스튜디오 CPU 프로파일러를 사용하여 앱과 상호작용하는 동안 앱의 CPU 사용량 및 스레드 활동이 실시간으로 검사됩니다. 개발자는 기록된 메서드 트레이스, 함수 트레이스, 시스템 트레이스에서 세부정보를 검사할 수도 있습니다. 메모리 프로파일러에서는 터치 이벤트, Activity 변경사항, 가비지 컬렉션 이벤트와 관련된 메모리 사용량을 간략하게 확인할 수 있습니다.
Perfetto는 Android 10에 도입된 플랫폼 전반 추적 도구로서, Android, Linux, Chrome을 위한 정교한 오픈소스 추적 프로젝트입니다. Systrace에 비해 상위 집합의 데이터 소스를 제공하며, 개발자는 임의의 긴 트레이스를 프로토콜 버퍼 바이너리 스트림에 기록할 수 있습니다. 이러한 트레이스는 Perfetto UI에서 열 수 있습니다.
시스템 추적 유틸리티는 기기 활동을 트레이스 파일에 저장하는 Android 도구입니다. Android 10(API 수준 29) 또는 이후 버전을 실행하는 기기에서는 트레이스 파일이 Perfetto 형식으로 저장됩니다. 이 문서의 후반부에 설명됩니다. 이전 버전의 Android를 실행하는 기기에서는 트레이스 파일이 Systrace 형식으로 저장됩니다.
Systrace는 기존 플랫폼에서 제공되는 명령줄 도구로, 단기간에 걸친 기기 활동을 압축된 텍스트 파일로 기록합니다. 이 도구는 CPU 스케줄러, 디스크 활동 및 앱 스레드와 같은 Android 커널의 데이터를 결합한 보고서를 생성합니다. Systrace는 모든 Android 플랫폼 버전에서 작동하지만 Android 10 이상을 실행하는 기기에는 Perfetto를 사용하는 것이 좋습니다.
그림 1. 약 20초간의 앱 상호작용을 보여주는 샘플 Perfetto 트레이스 뷰
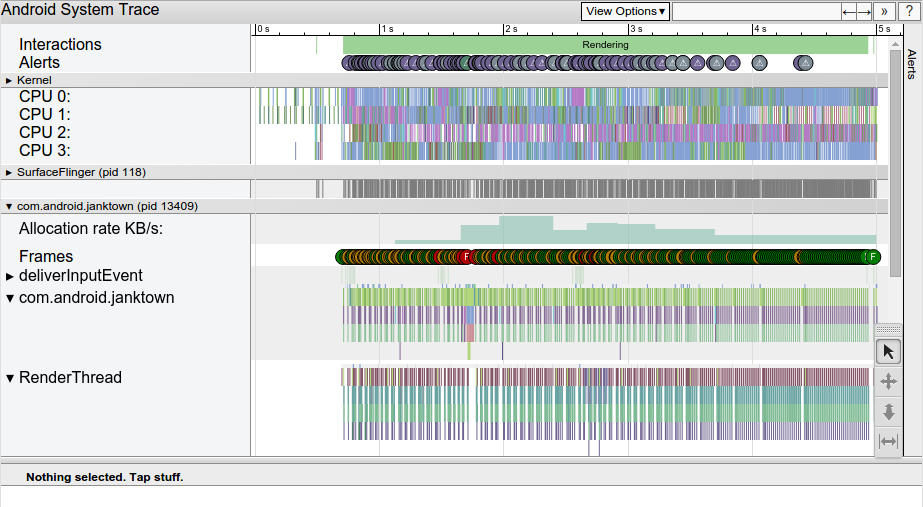
그림 2. 앱과의 5초간 상호작용을 보여주는 샘플 Systrace HTML 보고서
두 보고서 모두 일정 기간 동안 Android 지원 기기의 시스템 프로세스에 관한 전반적인 상황을 제공합니다. 또한 이 보고서는 캡처된 추적 정보를 검사하여 UI 버벅거림 또는 높은 전력 소모와 같은 관찰한 문제를 강조 표시합니다.
Perfetto와 Systrace는 상호 운용 가능합니다.
Perfetto UI에서 Perfetto 파일과 Systrace 파일을 모두 엽니다. Perfetto UI의 기존 Systrace 뷰어로 Systrace 파일을 엽니다(Open with legacy UI 링크 클릭).
Systrace나 Perfetto에서 근본 원인을 보다 쉽게 분석할 수 있도록 코드의 특정 섹션에 맞춤 라벨을 적용할 수 있는 방법을 설명합니다.
이 페이지에 나와 있는 콘텐츠와 코드 샘플에는 콘텐츠 라이선스에서 설명하는 라이선스가 적용됩니다. 자바 및 OpenJDK는 Oracle 및 Oracle 계열사의 상표 또는 등록 상표입니다.
최종 업데이트: 2025-08-21(UTC)
[[["이해하기 쉬움","easyToUnderstand","thumb-up"],["문제가 해결됨","solvedMyProblem","thumb-up"],["기타","otherUp","thumb-up"]],[["필요한 정보가 없음","missingTheInformationINeed","thumb-down"],["너무 복잡함/단계 수가 너무 많음","tooComplicatedTooManySteps","thumb-down"],["오래됨","outOfDate","thumb-down"],["번역 문제","translationIssue","thumb-down"],["샘플/코드 문제","samplesCodeIssue","thumb-down"],["기타","otherDown","thumb-down"]],["최종 업데이트: 2025-08-21(UTC)"],[],[],null,["# Overview of system tracing\n\nRecording device activity over a short period of time is known as *system\ntracing*. System tracing produces a trace file that you can use to generate a\nsystem report. This report helps you identify how best to improve your app or\ngame's performance.\n\nFor a comprehensive introduction to tracing and profiling, see the\n[Tracing 101](https://perfetto.dev/docs/tracing-101) page in the\nPerfetto documentation.\n\nThe Android platform provides several different options for capturing traces:\n\n- Android Studio CPU and memory profiler\n- Perfetto command-line tool (Android 10 and higher)\n- System tracing utility\n- Systrace command-line tool\n\nThe Android Studio CPU profiler inspects your app's CPU usage and thread\nactivity in real time while you interact with your app. You can also inspect the\ndetails in recorded method traces, function traces, and system traces. The\nmemory profiler gives an overview of memory usage in relation to touch events,\n[`Activity`](/reference/android/app/Activity) changes, and garbage collection\nevents.\n\nPerfetto is the platform-wide tracing tool introduced in\nAndroid 10. It is a sophisticated open source tracing project for\nAndroid, Linux, and Chrome. It offers a superset of data sources compared to\nSystrace and lets you record arbitrarily long traces in a protocol buffer binary\nstream. You can open these traces in the [Perfetto\nUI](https://ui.perfetto.dev/#!/).\n\nThe System tracing utility is an Android tool that saves device activity to a\ntrace file. On a device running Android 10 (API level 29) or higher, trace files\nare saved in Perfetto format, as shown later in this document. On a device\nrunning an earlier version of Android, trace files are saved in the Systrace\nformat.\n\nSystrace is a legacy platform-provided command-line tool that records device\nactivity over a short period of time in a compressed text file. The tool\nproduces a report that combines data from the Android kernel, such as the CPU\nscheduler, disk activity, and app threads. Systrace works on all Android\nplatform versions, but we recommend Perfetto for devices running Android 10 and\nhigher.\n**Figure 1.** A sample Perfetto trace view, which shows about 20 seconds\nof interaction with an app.\n**Figure 2.** A sample Systrace HTML report, which shows five seconds of\ninteraction with an app.\n\nBoth reports provide an overall picture of an Android-powered device's system\nprocesses for a given period of time. The report also inspects the captured\ntracing information to highlight problems that it observes, such as UI jank or\nhigh power consumption.\n\nPerfetto and Systrace are interoperable:\n\n- Open both Perfetto files and Systrace files in the Perfetto UI. Open Systrace files with the legacy Systrace viewer in the Perfetto UI by clicking the **Open with legacy UI** link.\n- [Convert a Perfetto trace to the legacy Systrace text\n format](https://docs.perfetto.dev/#/traceconv.md) using the `traceconv` tool.\n\n| **Note:** Systrace and Perfetto don't collect detailed information about code execution within your app process. For more detailed information about which methods your app is executing and how many CPU resources it's using, use the [CPU profiler](/studio/profile/cpu-profiler) in Android Studio.\n\nSystem tracing guides\n---------------------\n\nTo learn more about system tracing tools, see the following guides:\n\n[**Inspect CPU activity with CPU Profiler**](/studio/profile/cpu-profiler)\n: Shows how to profile your app's CPU usage and thread activity in Android\n Studio.\n\n[**Capture a system trace on a device**](/topic/performance/tracing/on-device)\n: Explains how to capture a system trace directly on any device running\n Android 9 (API level 28) or higher.\n\n[**Capture a system trace on the command line**](/topic/performance/tracing/command-line)\n: Defines the different options and flags that you can pass into the\n command-line interface for Systrace.\n\n[**Run Perfetto using adb**](/studio/command-line/perfetto)\n: Describes how to run the `perfetto` command-line tool to capture traces.\n\n[**Quickstart: Record traces on Android**](https://perfetto.dev/#/running.md)\n: External documentation that describes how to build and run the `perfetto`\n command-line tool to capture traces.\n\n[**Quickstart: Record traces on Android**](https://perfetto.dev/#/running.md)\n: The Perfetto web-based trace viewer opens Perfetto traces and displays a\n complete report. You can also open Systrace traces in this viewer using the\n legacy UI option.\n\n[**Navigate a Systrace report**](/topic/performance/tracing/navigate-report)\n: Lists the elements of a typical report, presents keyboard shortcuts for\n navigating through the report, and describes how to identify types of\n performance problems.\n\n[**Define custom events**](/topic/performance/tracing/custom-events)\n: Describes how you can apply custom labels to specific sections of your code,\n allowing for easier root-cause analysis in Systrace or Perfetto."]]