
短期間のデバイス アクティビティを記録することをシステム トレースといいます。システム トレースは、システム レポートの生成に使用できるトレース ファイルを生成します。このレポートを活用することで、アプリやゲームのパフォーマンスを改善する最適な方法を見つけることができます。
トレースとプロファイリングの概要については、Perfetto ドキュメントのトレースの入門ガイドページをご覧ください。
Android プラットフォームには、トレースをキャプチャするために数種類のオプションが用意されています。
- Android Studio の CPU Profiler と Memory Profiler
- Perfetto コマンドライン ツール(Android 10 以降)
- システム トレース ユーティリティ
- Systrace コマンドライン ツール
Android Studio の CPU Profiler は、アプリを操作している間、アプリの CPU 使用率とスレッド アクティビティをリアルタイムで検査します。記録されたメソッド トレース、関数トレース、システム トレースの詳細を検査することもできます。Memory Profiler は、タッチイベント、Activity の変更、ガベージ コレクション イベントに関連するメモリ使用量の概要を示します。
Android 10 で導入された Perfetto は、プラットフォーム全体の新しいトレースツールで、Android、Linux、Chrome 向けの洗練されたオープンソース トレース プロジェクトです。提供するデータソースは Systrace が提供するもののスーパーセットであり、プロトコル バッファ バイナリ ストリームに任意の長さのトレースを記録できます。これらのトレースは Perfetto UI で開くことができます。
システム トレース ユーティリティは、デバイスのアクティビティをトレース ファイルに保存する Android ツールです。Android 10(API レベル 29)以降を搭載しているデバイスの場合、トレース ファイルは、このドキュメントで後述するように Perfetto 形式で保存されます。これより前のバージョンの Android を搭載したデバイスでは、トレース ファイルは Systrace 形式で保存されます。
Systrace はプラットフォームに用意されている、以前のコマンドライン ツールであり、短期間のデバイス アクティビティを圧縮テキスト ファイルに記録します。このツールは、CPU スケジューラ、ディスク アクティビティ、アプリスレッドなど、Android カーネルのデータを組み合わせたレポートを作成します。Systrace はすべての Android プラットフォーム バージョンで動作しますが、Android 10 以降を搭載したデバイスには Perfetto をおすすめします。

図 1. アプリとの約 20 秒間のインタラクションを示す Perfetto トレースビューのサンプル。
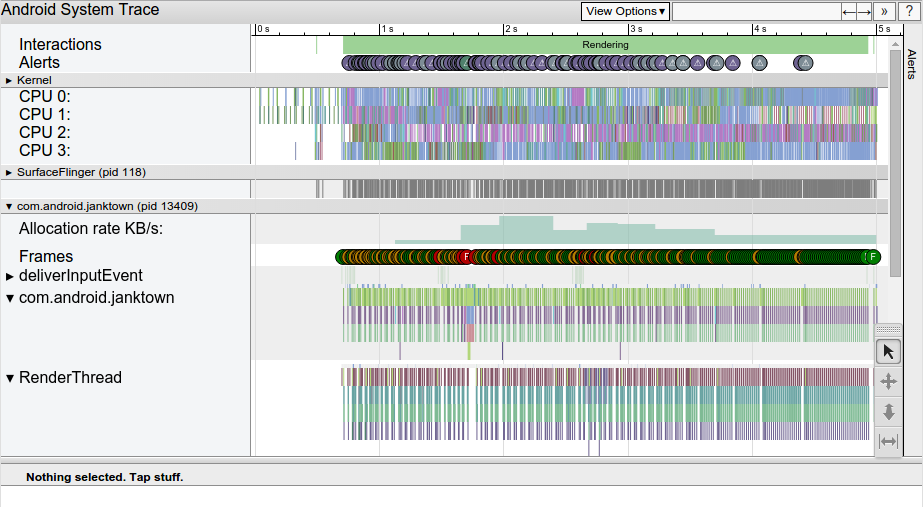
図 2. アプリとの 5 秒間のインタラクションを示す Systrace HTML レポートのサンプル。
どちらのレポートにも、一定期間を対象に、Android 搭載デバイスのシステム プロセスの全体像が表示されます。また、このレポートは、キャプチャしたトレース情報を検査して、UI ジャンクや高電力消費など、検出した問題点をハイライト表示します。
Perfetto と Systrace は相互運用可能です。
- Perfetto ファイルと Systrace ファイルはどちらも Perfetto UI で開きます。Perfetto UI で [Open with legacy UI] をクリックし、以前の Systrace ビューアを使用して Systrace ファイルを開きます。
traceconvツールを使用して Perfetto トレースを以前の Systrace テキスト形式に変換します。
システム トレースガイド
システム トレースツールの詳細については、次のガイドをご覧ください。
- CPU Profiler を使用して CPU アクティビティを検査する
- Android Studio でアプリの CPU 使用率とスレッド アクティビティをプロファイリングする方法について説明します。
- デバイス上でシステム トレースをキャプチャする
- Android 9(API レベル 28)以降を搭載しているデバイス上で直接システム トレースをキャプチャする方法について説明します。
- コマンドラインでシステム トレースをキャプチャする
- Systrace 用のコマンドライン インターフェースに渡すことができるさまざまなオプションやフラグを定義します。
- adb を使用して Perfetto を実行する
perfettoコマンドライン ツールを実行してトレースをキャプチャする方法について説明します。- クイックスタート: Android でトレースを記録する
perfettoコマンドライン ツールをビルドして実行し、トレースをキャプチャする方法についての外部ドキュメント。- クイックスタート: Android でトレースを記録する
- Perfetto のウェブベースのトレース ビューアで Perfetto トレースを開き、完全なレポートを表示します。このビューアでは、以前の UI オプションを使用して Systrace トレースを開くこともできます。
- Systrace レポートを操作する
- 一般的なレポートの要素をリスト表示し、レポートを操作するためのキーボード ショートカットを示し、パフォーマンスに関する問題のタイプを識別する方法について説明します。
- カスタム イベントを定義する
- 特定のコード セクションにカスタムラベルを適用して、Systrace または Perfetto での根本原因分析を容易にする方法について説明します。