Native memory refers to allocations made in C, C++, or Rust code using functions
like `malloc`, `free`, or operators like `new` and `delete`. Unlike Java, native
memory is not automatically garbage-collected; you are responsible for managing
the lifecycle of every allocation.
## Profiling with heapprofd
`heapprofd` is the platform-wide native heap profiler for Android. It uses a
sampling-based approach to record allocations and deallocations with minimal
overhead.
> [!NOTE]
> **Note:** To run `heapprofd`, you must build your app with `` or ``.
### Using the heap_profile tool
The easiest way to capture a native heap profile is using the `heap_profile`
script provided by Perfetto.
1. Download the script from the Perfetto repository:
curl -O https://raw.githubusercontent.com/google/perfetto/master/tools/heap_profile
chmod +x heap_profile
2. Ensure your device is connected via ADB and run the tool, specifying the
target process:
./heap_profile -n
3. Perform the user journey in your application.
4. Stop the profiler (Ctrl+C). The script will automatically pull the profile,
start a local `pprof` server, and open your web browser to view the
flamegraph.
### Triggering snapshots
You can also trigger a dump of the current heap state while a Perfetto trace is
running:
adb shell killall -USR1 heapprofd
This creates a snapshot (diamond icon) in the Perfetto UI.
Use an example `heapprofd` configuration like this:
buffers: {
size_kb: 65536
}
data_sources: {
config {
name: "android.heapprofd"
heapprofd_config {
sampling_interval_bytes: 4096
process_cmdline: "com.example.myapp"
}
}
}
duration_ms: 20000
## Analyzing with pprof
The output of heapprofd is a set of `.pb.gz` files. If you used the
`heap_profile` script, these files are automatically pulled to your host
machine's temporary directory (e.g., `/tmp/heap_profile-XXXXXX` on Linux or
macOS), and a convenient symlink is created at `/tmp/heap_profile-latest`.
> [!NOTE]
> **Note:** If you recorded the heap profile as part of a full trace using the Perfetto UI or CLI, the heap dumps are embedded within the `.pftrace` file. You can extract them into `.pb.gz` format using the Perfetto `traceconv` tool.
See also: [Recording memory profiles with
Perfetto](https://perfetto.dev/docs/getting-started/memory-profiling)
You can manually analyze these files using pprof, a tool for visualization and
analysis of profiling data.
### Viewing flamegraphs
Upload your profile to a `pprof` viewer such as Google pprof, [available on
GitHub](https://github.com/google/pprof).
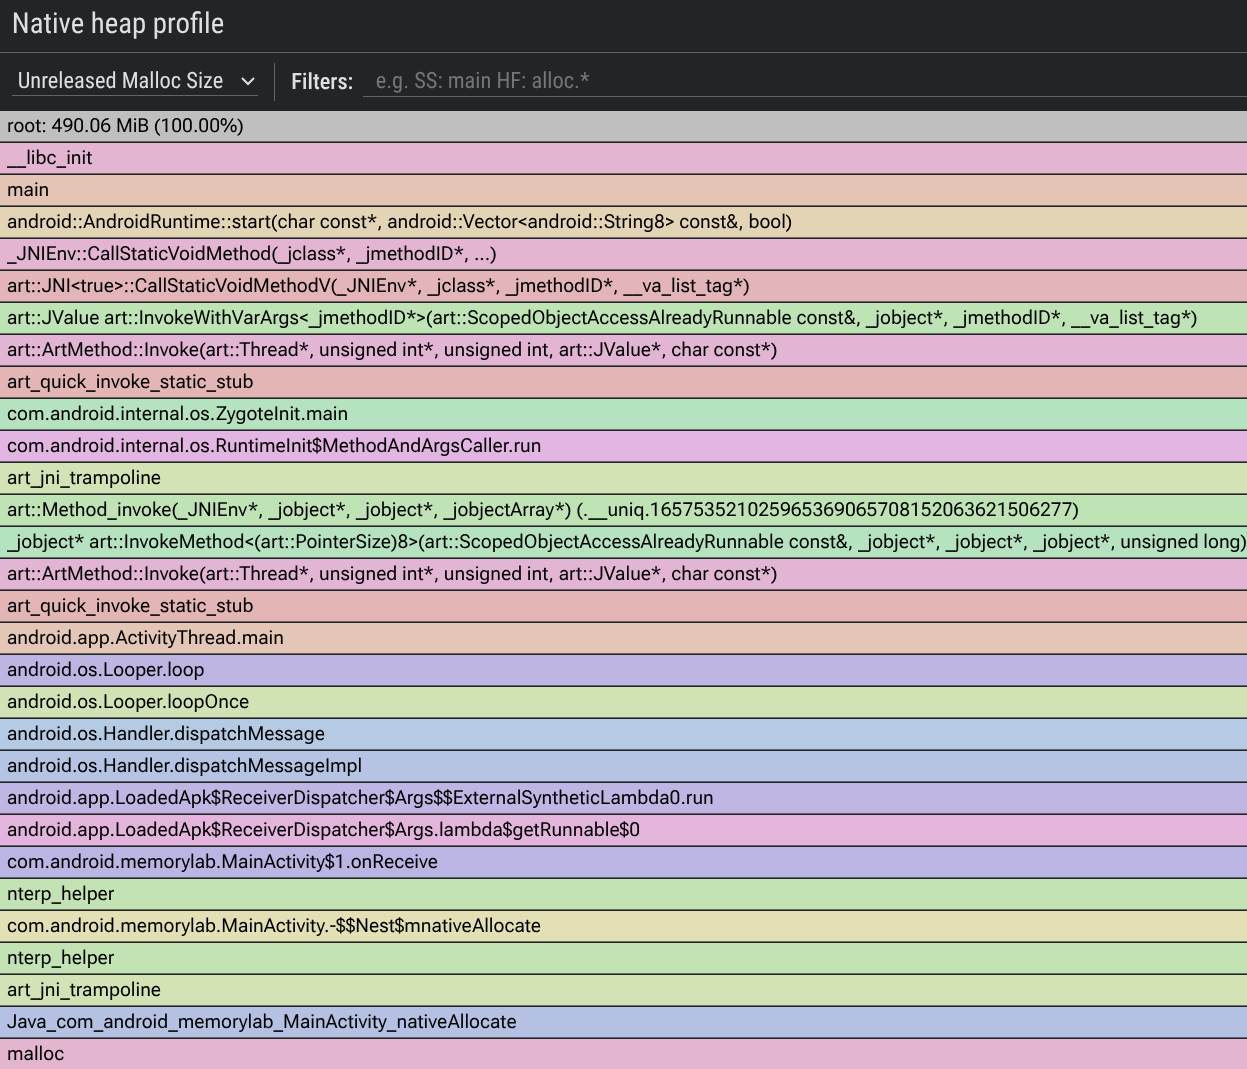
- **Unreleased Memory**: Look for allocations that were made but never freed. A flamegraph will show the call stacks responsible for the most unreleased bytes.
- **Total Allocations**: You can also view the total count or bytes allocated over the entire profile duration, which is useful for finding allocation churn in native code.
#### PerfettoSQL for native heap profiles
If you captured the native heap profile within a full Perfetto trace (using
`heapprofd`), you can query the raw allocations. This is useful for counting
objects or summarizing bytes:
SELECT
upid,
count(id) AS allocation_count,
sum(size) AS total_bytes
FROM heap_profile_allocation
GROUP BY upid
ORDER BY total_bytes DESC;
You can also view the total count or bytes allocated during the profile, even if
they were subsequently freed. This is useful for finding "allocation churn."
### Symbolization
If you see "unknown" frames in your flamegraph, you need to symbolize the
profile. This requires providing the unstripped versions of your native
libraries (`.so` files with debug symbols).
**Where to find symbols in AOSP:** Symbols are generated during the build
process and stored at: `out/target/product//symbols/`
Use the `--sym-dir` flag with the `heap_profile` tool:
./heap_profile -n --sym-dir
## Analyzing graphics and DMA-BUFs
On modern Android-powered devices, a significant portion of memory is often
consumed by graphics buffers, known as **DMA-BUFs**. These are used for UI
layers, camera frames, and video buffers.
Because DMA-BUFs are shared between processes (e.g., between your app and the
`surfaceflinger` or camera service), they can be hard to track. The
`dmabuf_dump` tool reports all processes using DMA-BUFs.
*** ** * ** ***
**[← Bitmaps](https://developer.android.com/topic/performance/memory/guide/bitmaps) \| [↑ Up](https://developer.android.com/topic/performance/memory/guide) \| [WebView →](https://developer.android.com/topic/performance/memory/guide/webview-memory)**