Java and Kotlin applications manage memory through a garbage-collected heap.
When objects are no longer reachable, the garbage collector (GC) eventually
reclaims their space. Memory leaks occur when objects that are no longer needed
are still held by "GC roots," preventing them from being reclaimed.

## Core concepts

### GC roots

A **GC Root** is a special type of object that the garbage collector treats as
always reachable. Examples include:

- **Active threads** (and objects referenced from their currently executing Java stack frames).
- **Classes** with actively running methods.
- **JNI references** (global or local references held by native code).

### Path to GC root

As long as there is a chain of references from a GC Root to an object, that
object is "reachable" and cannot be garbage collected. This chain is called the
**Path to GC Root**. To fix a memory leak, you must identify and break this
chain.

![Path to GC Root](https://developer.android.com/static/topic/performance/memory/guide/images/java-memory/path_to_gc_root.png)

### Dominator trees

While the path to GC root tells you *why* an object is alive, it doesn't tell
you how much memory would be reclaimed if that reference was broken. For this,
we use **Dominator Trees**.

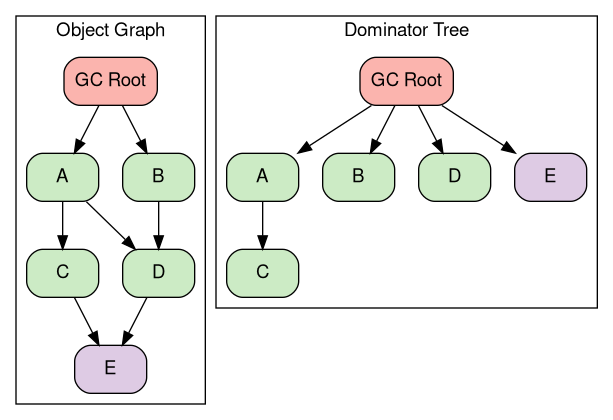
Object **A** is said to **dominate** object **B** if every path from any GC root
to **B** must pass through **A** . If **A** dominates **B** , then reclaiming
**A** will also guarantee that **B** can be reclaimed, because there are no
other paths from any root to **B**.

The following diagram shows an object graph and its corresponding dominator
tree. Notice how object **D** is reached by both **A** and **B** in the graph,
so neither **A** nor **B** dominates **D** ; instead, the **GC Root** is its
nearest dominator.
![Dominator Tree](https://developer.android.com/static/topic/performance/memory/guide/images/java-memory/dominator_tree.png)

## Obtaining Java heap dumps

A heap dump is a snapshot of all objects in the Java heap at a specific point in
time.

### Using ADB

To capture a heap dump from a running process, you can pass the package name
directly to `am dumpheap`. To run this command, you must build your app with
`<profileable android:shell="true"/>` or `<debuggable>`.

> [!NOTE]
> **Note:** In modern Android versions, bitmap pixel data is stored in the native heap. To tell the system to include a snapshot of this native bitmap data inside the Java heap dump (which is essential for AHAT to analyze bitmaps), you must pass the `-b` flag.

    # 1. Trigger the dump (the command takes a moment to complete):
    adb shell am dumpheap -g -b png com.android.memorylab /data/local/tmp/heap.hprof

    # 2. Pull the file to your development machine:
    adb pull /data/local/tmp/heap.hprof .

### Using Perfetto

Perfetto can also capture Java heap dumps as part of a system-wide trace by
enabling the `android.java_hprof` data source in your Perfetto config. This is
useful for correlating heap state with other system events.

> [!IMPORTANT]
> **Important:** Unlike standard `.hprof` files, Perfetto's Java heap dumps only capture the **object reference graph** , not the actual data contents of fields (like strings or byte arrays). Furthermore, **AHAT cannot load Perfetto-trace
> files** ; you must view them in the [Perfetto UI](https://ui.perfetto.dev).

To capture a heap dump for the MemoryLab app using Perfetto, you can use the
following command:

    # Create a temp file for the configuration
    cat > /tmp/java_heap.pbtx <<EOF
    data_sources: {
        config {
            name: "android.java_hprof"
            java_hprof_config {
                process_cmdline: "com.android.memorylab"
            }
        }
    }
    EOF

    # Run trace command referencing the file
    external/perfetto/tools/record_android_trace -o java_heap.perfetto-trace \
      -t 10s -c /tmp/java_heap.pbtx

See: [Java heap dumps on Perfetto
docs](https://perfetto.dev/docs/data-sources/java-heap-profiler).

## Analyzing with AHAT

AHAT (Android Heap Analysis Tool) is the recommended tool for viewing `.hprof`
files in a web browser.

### Starting AHAT

If you have `ahat` installed on your path, launch it with:

    ahat heap.hprof

Or run the standalone jar:

    java -jar ahat.jar heap.hprof

Then open your browser to <http://localhost:7100>.

For details on obtaining or building AHAT, see the
[AHAT source repository](https://android.googlesource.com/platform/art/+/main/tools/ahat/).

### Key analysis workflows

#### Finding leaks

Search for your Activity class (`MainActivity`) in the **Allocations** view.
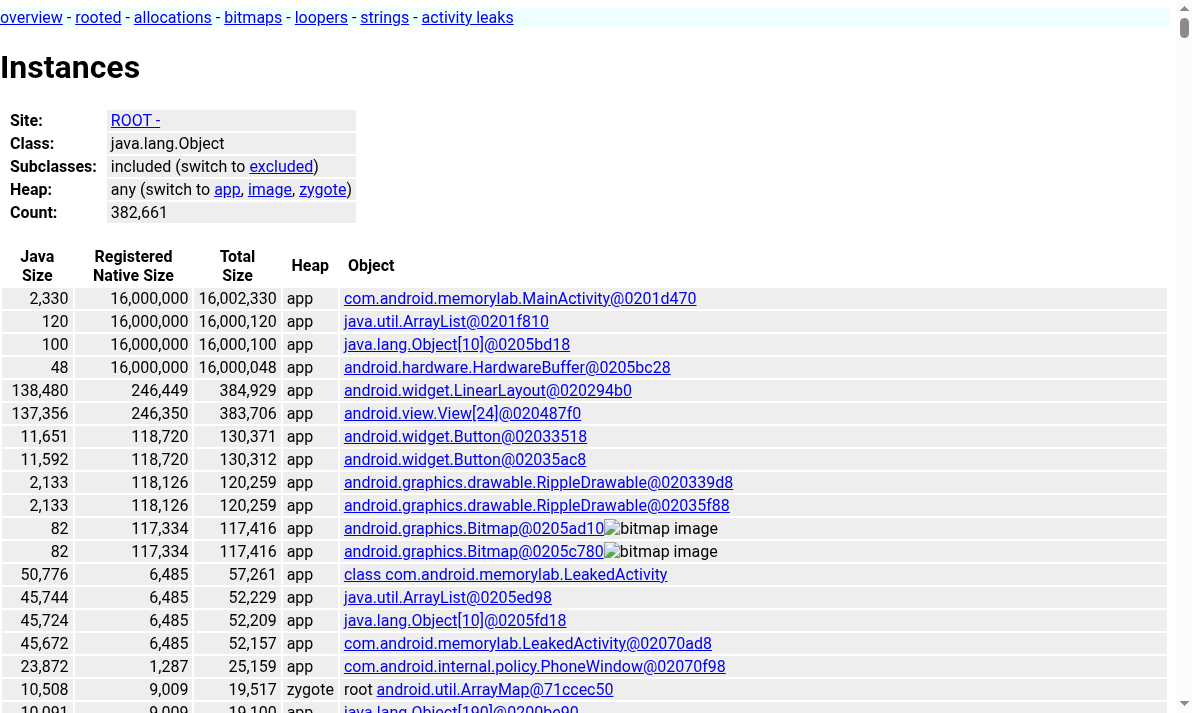
![AHAT view showing instances](https://developer.android.com/static/topic/performance/memory/guide/images/java-memory/ahat-instances.png)

Click the class to find all **Instances**.
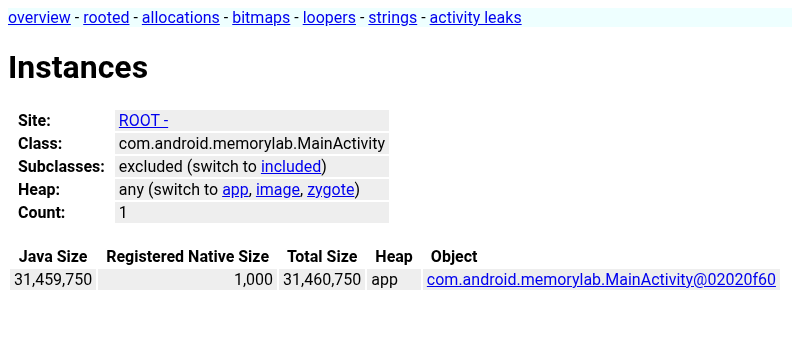
![AHAT view showing MainActivity
instances](https://developer.android.com/static/topic/performance/memory/guide/images/java-memory/ahat-MainActivity-instances.png) Click on the
`MainActivity` instance to inspect it.
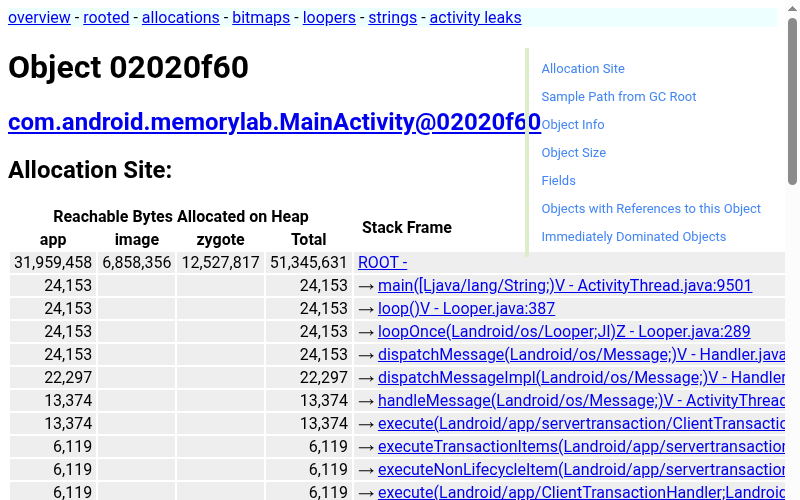
![AHAT showing an instance details](https://developer.android.com/static/topic/performance/memory/guide/images/java-memory/MainActivity.png)

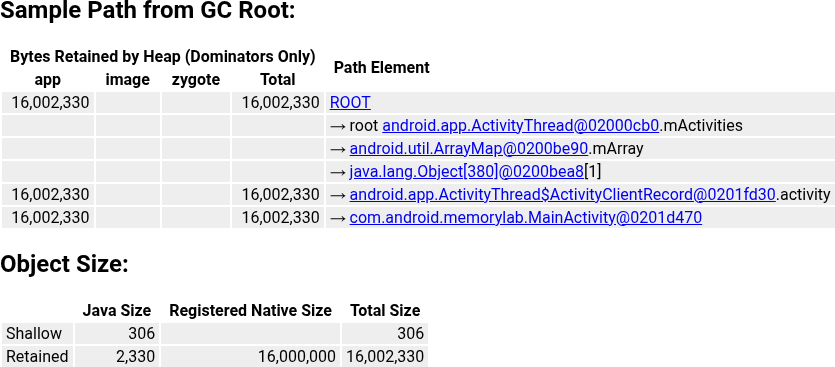
In the instance view, you can find the **Sample Path from GC Root** , which shows
the chain of references preventing the object from being garbage collected, and
the **Object Size**, which shows how much memory is being retained by this
specific instance.
![AHAT Sample Path from GC Root and Object Size](https://developer.android.com/static/topic/performance/memory/guide/images/java-memory/MainActivity-path-gc-root.png)

#### Analyzing bitmaps

AHAT has special support for viewing `android.graphics.Bitmap` objects, which
are often large memory consumers. Click on a Bitmap instance to see a rendered
preview of its contents.

![AHAT Bitmap Preview](https://developer.android.com/static/topic/performance/memory/guide/images/java-memory/ahat-bitmaps.png)

#### Activity leaks page

AHAT has a specialized view for identifying leaked Activities, which are one of
the most common and impactful memory leaks in Android.

1. **Action** : In MemoryLab, tap **Leak an Activity** . This launches `LeakedActivity` which intentionally leaks itself.
2. **Dump**: Take a heap dump.
3. **Analyze** : Click on **Activity Leaks** in the AHAT sidebar.
4. **Verify** : AHAT will list `com.android.memorylab.LeakedActivity` as leaked because its `mDestroyed` field is true (indicating the Activity lifecycle has ended) but it is still reachable from a GC root.

![AHAT Activity Leaks Page](https://developer.android.com/static/topic/performance/memory/guide/images/java-memory/ahat-activity-leaks.png)

#### Diffing heap dumps

Comparing two heap dumps is one of the most powerful ways to identify memory
issues. By comparing a "clean" baseline dump with a dump taken after performing
some actions, you can immediately see which objects have accumulated.

**Exercise: Identifying Leaks through Diffing**

1. **Baseline**: Launch MemoryLab and take a baseline heap dump:

       adb shell am dumpheap com.android.memorylab /data/local/tmp/base.hprof
       adb pull /data/local/tmp/base.hprof .

2. **Action** : Tap **Allocate Java Memory(10MB)** several times in the app.

3. **Final**: Take a second heap dump:

       adb shell am dumpheap com.android.memorylab /data/local/tmp/leaked.hprof
       adb pull /data/local/tmp/leaked.hprof .

4. **Compare**: Start AHAT with the second dump as primary and the first as the
   baseline:

       java -jar out/host/linux-x86/framework/ahat.jar leaked.hprof --baseline base.hprof

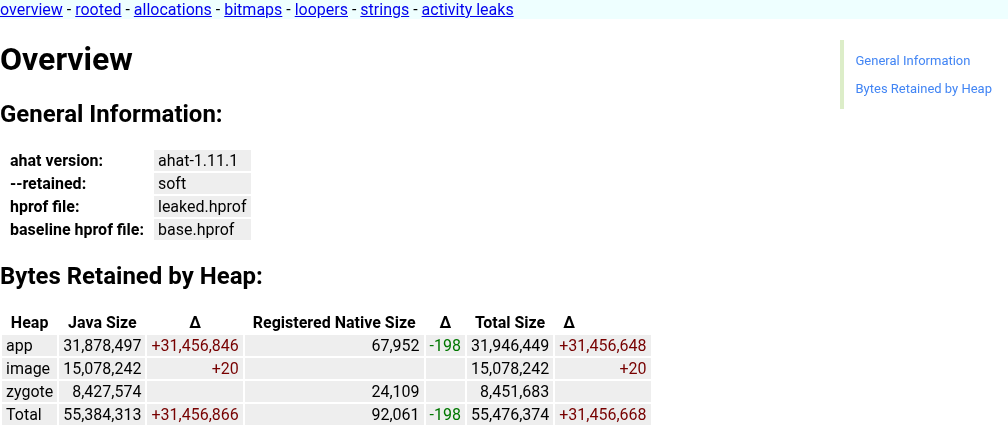
5. **Analyze Overview** : The **Overview** page now includes a **Δ (Delta)**
   column. You will see a large positive delta for the `app` heap, indicating
   significant memory growth.
![AHAT Overview with Delta](https://developer.android.com/static/topic/performance/memory/guide/images/java-memory/ahat-overview-diff.png)

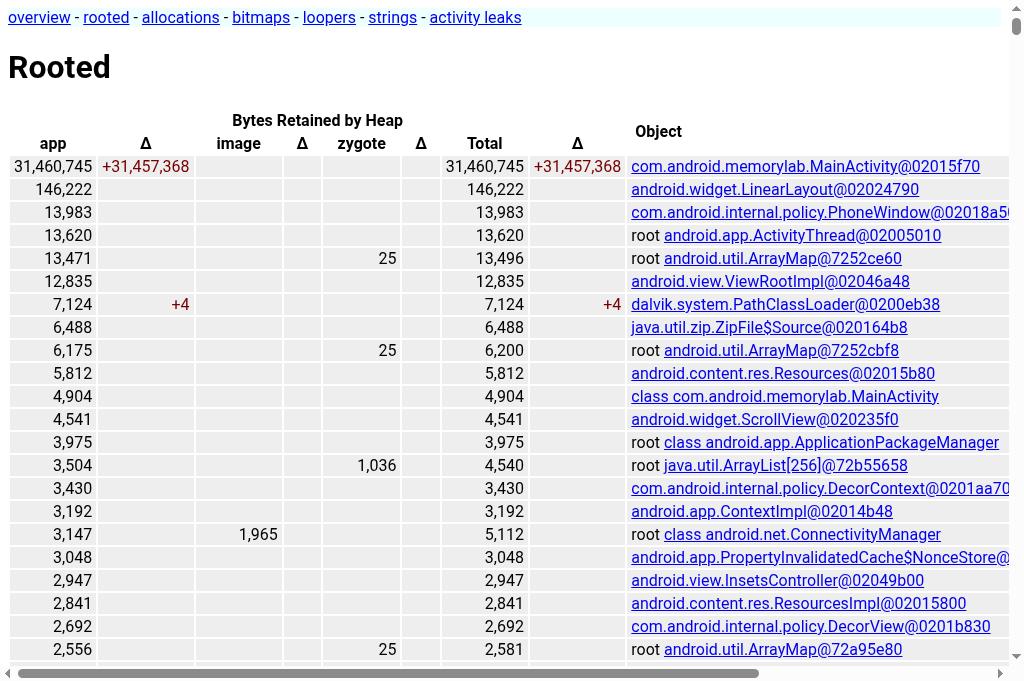
1. **Drill Down** : Click on **rooted** in the menu. This page shows objects reachable from GC roots, sorted by their retained size. You'll see `MainActivity` at the top with a large positive delta.
![AHAT Rooted View with Delta](https://developer.android.com/static/topic/performance/memory/guide/images/java-memory/ahat-rooted-diff.png)

#### Recording allocation stack traces

While the **Sample Path from GC Root** tells you *why* an object is still alive,
it doesn't tell you *how* it was created. Allocation stack traces provide the
exact line of code that allocated an object.

**Concept \& Trade-offs** : Recording every allocation's stack trace is
computationally expensive and consumes significant memory. In a large production
app, this can make the app nearly unusable. However, **MemoryLab** is a small
enough application that we can safely enable this tracking to pinpoint the
source of allocations.

**Exercise: Identifying the source of Byte Arrays**

1. **Start with Tracking** : Force-stop MemoryLab and restart it with the
   `--track-allocation` flag. Increase the default stack depth to capture more
   context.

       # Increase the allocation tracker's stack depth (requires a process restart)
       adb shell setprop dalvik.vm.allocTrackerMaxStack 16

       adb shell am force-stop com.android.memorylab
       adb shell am start --track-allocation -n com.android.memorylab/.MainActivity

2. **Action** : Tap **Allocate Java Memory(10MB)** a few times.

3. **Dump**: Take a heap dump and pull it.

4. **Analyze** : Open the dump in AHAT. Navigate to a large `byte[]` instance.
   (e.g., inspect `MainActivity` → `mJavaAllocations` (`ArrayList`) →
   `elementData` (`Object[]`) → array element `[0]`).

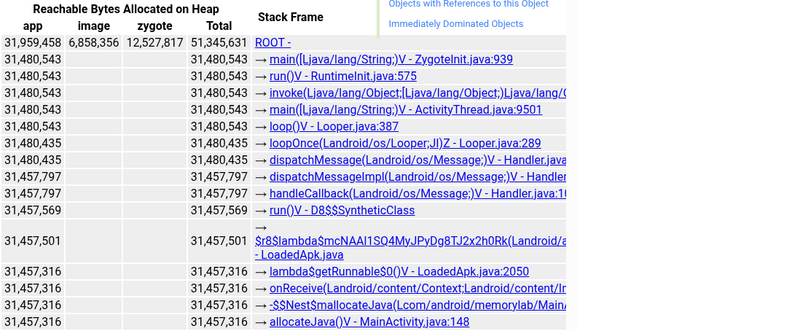
5. **Verify** : In the instance view, look at the **Allocation Site** section.
   It will show the full stack trace leading to `MainActivity.allocateJava`.
![AHAT Allocation Site](https://developer.android.com/static/topic/performance/memory/guide/images/java-memory/ahat-allocation-site.png)

#### Hunting duplicate strings and hydration bloat

Even when an app has no classic GC-root leaks, its live Java heap can be
bloated by thousands of duplicate `java.lang.String` instances created during
JSON, Protobuf, `Cursor`, or Room database deserialization. Repeated keys,
status strings, category labels, or URLs are often allocated anew on every
network response or database query. Across large feed, messaging, and content
apps, duplicate strings routinely account for 30% to 60% of live `String`
memory.

To inspect duplicate strings in AHAT:

1. Open the **Allocations** page and filter by `java.lang.String`.
2. When comparing two heap dumps with `--baseline`, check whether `java.lang.String` instance counts and total bytes grow disproportionately after hydrating a feed or loading a local cache.
3. Browse the `java.lang.String` instances table (sorted by size or value) to spot identical string values retained across multiple in-memory model objects.

- **Remedy** : Avoid calling `String.intern()` indiscriminately on arbitrary user or network input, because the runtime intern table is global and can introduce lock contention or retain strings longer than needed. Instead, deduplicate high-frequency domain strings during deserialization using a bounded, scoped deduplication cache (such as an `LruCache<String, String>` inside your parser or adapter), or represent fixed sets of values as enums or integer constants.

## Analyzing Java memory dynamics (combined profile)

To get a complete picture of an application's memory behavior, you can combine
memory counters, thread activity, and callstack-based allocation profiling into
a single Perfetto trace. This allows you to correlate system-wide memory metrics
(like RSS and heap size) with specific code execution and allocation sites.

We will use a combined configuration that enables:

- **Memory Counters** (`linux.process_stats`): Polls RSS and other memory metrics.
- **ATrace** (`dalvik`, `memory`, `sched` categories): Captures thread states and GC events.
- **Heapprofd** (`android.heapprofd`): Targets both `com.android.art` (Java) and `libc.malloc` (native) heaps with continuous dumps every 5 seconds.

### Exercise: combined memory analysis

In this exercise, we will run the MemoryLab app and perform a sequence of memory
operations to observe different patterns in the trace:

1. **Baseline**: Idle state.
2. **Java Churn**: Temporary allocations that are immediately garbage collected.
3. **Persistent Java Allocation**: Allocating Java objects that remain in memory.
4. **Bitmap Allocation**: Allocating large graphics assets (which sit in the native heap/graphics memory).
5. **Reclamation**: Freeing all allocated resources.

#### 1. Launch and prepare

1. Force-stop and restart the app to ensure a clean state:

       adb shell am force-stop com.android.memorylab
       adb shell am start -W -n com.android.memorylab/.MainActivity

#### 2. Start tracing and trigger sequence

We will start a 40 second trace and trigger the memory events using `am
broadcast` commands.

1. **Start the trace**:

       adb shell perfetto -c - --txt -o /data/misc/perfetto-traces/java_memory.perfetto-trace <<EOF
       buffers: {
           size_kb: 131072
           fill_policy: RING_BUFFER
       }
       data_sources: {
           config {
               name: "linux.process_stats"
               target_buffer: 0
               process_stats_config {
                   scan_all_processes_on_start: true
                   proc_stats_poll_ms: 100
               }
           }
       }
       data_sources: {
           config {
               name: "linux.ftrace"
               target_buffer: 0
               ftrace_config {
                   ftrace_events: "sched/sched_switch"
                   ftrace_events: "task/task_newtask"
                   ftrace_events: "task/task_rename"
                   ftrace_events: "ftrace/print"
                   atrace_categories: "dalvik"
                   atrace_categories: "am"
                   atrace_categories: "res"
                   atrace_categories: "memory"
                   atrace_categories: "sched"
                   atrace_apps: "com.android.memorylab"
               }
           }
       }
       data_sources: {
           config {
               name: "android.heapprofd"
               target_buffer: 0
               heapprofd_config {
                   sampling_interval_bytes: 4096
                   process_cmdline: "com.android.memorylab"
                   heaps: "libc.malloc"
                   heaps: "com.android.art"
                   shmem_size_bytes: 8388608
                   block_client: true
                   continuous_dump_config {
                       dump_phase_ms: 1000
                       dump_interval_ms: 5000
                   }
               }
           }
       }
       duration_ms: 40000
       EOF

2. **Trigger the sequence** (run these commands in your host terminal while the
   trace is running, respecting the suggested timing):

       # Wait ~5s for trace initialization, then start Java churn:
       adb shell am broadcast -a com.android.memorylab.CHURN_JAVA

       # Wait ~10s (at 15s mark), allocate 10MB of persistent Java memory:
       adb shell am broadcast -a com.android.memorylab.ALLOC_JAVA

       # Wait ~5s (at 20s mark), allocate 20MB of Bitmaps (native/graphics):
       adb shell am broadcast -a com.android.memorylab.LEAK_BITMAP

       # Wait ~10s (at 30s mark), free everything:
       adb shell am broadcast -a com.android.memorylab.FREE_ALL

3. **Alternative (CLI Tool)** : You can also start the profile using the
   `heap_profile` script directly, targeting both Java and native heaps with
   continuous dumps:

       external/perfetto/tools/heap_profile -n com.android.memorylab \
         --heaps com.android.art,libc.malloc \
         -c 5000 \
         -d 40000 \
         -o java_memory_profile

#### 3. Analyzing the combined trace

Open the collected `java_memory.perfetto-trace` in the [Perfetto
UI](https://ui.perfetto.dev).

##### Key tracks in Perfetto

Before analyzing the timeline, locate these essential tracks for the
`com.android.memorylab` process:

1. **`mem.rss.anon` (Anonymous RSS)** : Found under the process's **Memory** section. This track measures the physical memory (RAM) allocated to the process by the OS. It represents the actual memory footprint.
2. **`Heap size (KB)`** : Also under the **Memory** section. This is a Dalvik/ART-specific counter representing the virtual address space reserved for the Java heap. It reflects the VM's internal heap limit, which fluctuates as objects are allocated and GC runs.
3. **`HeapTaskDaemon`**: Found in the list of threads under the process. This is the background thread where the ART Garbage Collector performs most of its work. Activity here indicates active GC passes.
4. **Continuous Allocation Dumps (heapprofd)** : Shown as colored slices along the top timeline. Each slice represents a duration in time. Clicking a single slice or selecting a time range allows you to inspect the **Flamegraph** (in the bottom pane) for either **com.android.art** (Java allocations) or **libc.malloc** (Native allocations) to see *what* was allocated during that period.

*** ** * ** ***

##### Chronological phase analysis

Let's review the trace chronologically to see how these tracks interact during
each phase of the exercise.

###### Phase 1: baseline (0s - 5s)

- **What is happening**: The app is idle, waiting for commands.
- **Track Status** :
  - `mem.rss.anon`: Flat line at the baseline (typically around 60-80MB depending on the device).
  - `Heap size (KB)`: Flat line, matching the initial Java heap allocation.
  - `HeapTaskDaemon`: Idle (no slices showing execution).
  - **Allocation Dumps**: Show minimal baseline allocations.

![Perfetto UI showing Phase 1 baseline](https://developer.android.com/static/topic/performance/memory/guide/images/java-memory/perfetto-phase1-baseline.png)

###### Phase 2: Java allocation churn (5s - 15s)

- **What is happening** : The `AllocationChurnThread` is started, repeatedly allocating 1MB arrays and discarding them.
- **Track Status** :
  - `Heap size (KB)`: Shows a rapid **sawtooth** pattern. The heap size climbs as allocations accumulate and drops sharply when the GC runs.
  - `HeapTaskDaemon`: Shows near-constant activity, with execution slices aligning perfectly with the drops in the `Heap size` sawtooth.
  - `mem.rss.anon`: Tracks the Java heap activity.
  - **Java Heap Allocation Dumps** : Selecting slices in this track shows **com.android.art** heap allocations.

![Perfetto UI showing Phase 2 churn](https://developer.android.com/static/topic/performance/memory/guide/images/java-memory/perfetto-phase2-churn.png)
The allocation samples reveal `AllocationChurnThread` as the primary allocator,
with all allocations sharing the same callstack that points to the lambda inside
`MainActivity.java`.

![Perfetto UI showing Phase 2 Java allocations](https://developer.android.com/static/topic/performance/memory/guide/images/java-memory/perfetto-phase2-allocations.png)

###### Phase 3: persistent Java allocation (15s - 20s)

- **What is happening** : We allocate 10MB of Java objects and keep a reference to them in `mJavaAllocations`.
- **Track Status** :
  - `Heap size (KB)`: The baseline of the sawtooth steps up by approximately 10MB.
  - `mem.rss.anon`: Steps up by approximately 10MB, as the OS must back this persistent allocation with new physical pages.
  - **Java Heap Allocation Dumps** : Selecting slices in this track shows **com.android.art** heap allocations.
  - **Allocation Dumps (Flamegraph)** : Inspecting the **com.android.art** heap for the dump taken in this window shows a new allocation path from `MainActivity.allocateJava` contributing to the retained size.

![Perfetto UI showing Phase 3 persistent Java
allocation](https://developer.android.com/static/topic/performance/memory/guide/images/java-memory/perfetto-phase3-persistent.png) Select an
allocation sample that covers a duration that overlaps with the 10MB increase
for the persistent allocation. You should see the allocation callstacks diverge
to two different sites, one responsible for the same short-lived allocation
churn we saw before, and the other for the new long-lived allocation.

![Perfetto UI showing Phase 3 Java allocations](https://developer.android.com/static/topic/performance/memory/guide/images/java-memory/perfetto-phase3-allocations.png)

###### Phase 4: bitmap allocation (20s - 30s)

- **What is happening**: We also allocate 20MB of Bitmaps.
- **Track Status** :
  - `Heap size (KB)`: Same as before.
  - `mem.rss.anon`: Shows a significant step up of approximately 20MB, corresponding to the native allocations for the Bitmap pixel data.
  - **Allocation Dumps (Flamegraph)** : This time focus on the slices for the **libc.malloc** (Native) heap.

![Perfetto UI showing Phase 4 Bitmap
Allocation](https://developer.android.com/static/topic/performance/memory/guide/images/java-memory/perfetto-phase4-bitmap.png) The native allocation
callstacks reveal the Bitmap allocation originating from native graphics
libraries. This is a good use case for native allocation tracking, since you
won't see these Bitmap allocations in the Java heap.

![Perfetto UI showing Phase 4 Native allocations](https://developer.android.com/static/topic/performance/memory/guide/images/java-memory/perfetto-phase4-allocations.png)

###### Phase 5: reclamation (30s - 40s)

- **What is happening** : We trigger `FREE_ALL`, clearing references to all persistent Java allocations and bitmaps, followed by an explicit `System.gc()`.
- **Track Status** :
  - `Heap size (KB)`: Drops back down to the baseline level.
  - `mem.rss.anon`: Drops back down, showing the OS reclaiming the physical pages.
  - `HeapTaskDaemon`: Shows a final burst of activity as it processes the garbage collection.

![Perfetto UI showing Phase 5 Reclamation](https://developer.android.com/static/topic/performance/memory/guide/images/java-memory/perfetto-phase5-reclamation.png)

## Monitoring historical OOMs (ApplicationExitInfo)

Catching an LMK as it happens is great for active debugging, but for field
telemetry, you can use the `ApplicationExitInfo` API. This allows your app to
discover why it was terminated in a previous session.

    ActivityManager am = getSystemService(ActivityManager.class);
    List<ApplicationExitInfo> exitReasons = am.getHistoricalProcessExitReasons(null, 0, 1);
    if (!exitReasons.isEmpty()) {
        ApplicationExitInfo info = exitReasons.get(0);
        if (info.getReason() == ApplicationExitInfo.REASON_LOW_MEMORY) {
            // App was killed by the system Low Memory Killer
        }
    }

## Best practices

1. **Baseline First**: Always take a "baseline" heap dump after the app has initialized but before performing the action you're testing.
2. **Use AHAT's Activity Leaks Page** : AHAT includes a dedicated **Activity
   Leaks** page that automatically identifies Activity instances that have been destroyed but are still held in memory. This is often the fastest way to find common leaks.
3. **Check Path to GC Roots** : For any leaked object, use the **Path from
   Root** view in AHAT to understand exactly which reference is keeping it alive (e.g., a static field, a long-running thread, or a registered listener).

*** ** * ** ***

**[← Tools](https://developer.android.com/topic/performance/memory/guide/tools-overview) \| [↑ Up](https://developer.android.com/topic/performance/memory/guide) \| [Bitmaps →](https://developer.android.com/topic/performance/memory/guide/bitmaps)**