Applicable XR devices This guidance helps you build experiences for these types of XR devices. [Learn about XR device types →](https://developer.android.com/develop/xr/devices)  Display Glasses [](https://developer.android.com/develop/xr/devices#audio-display) [Learn about XR device types →](https://developer.android.com/develop/xr/devices)
While you're building augmented experiences with Jetpack Compose Glimmer
components for display glasses, you can inspect and debug your layout with the
Layout Inspector in Android Studio.
[ See also If you're new to using the Layout Inspector, learn how to do other common tasks in the layout debugging guide.](https://developer.android.com/studio/debug/layout-inspector)
## Open the Layout Inspector
1. In Android Studio, [run your app](https://developer.android.com/studio/run).
2. When you see a screen you want to inspect, select **Tools \> Layout
Inspector** from the menu bar.
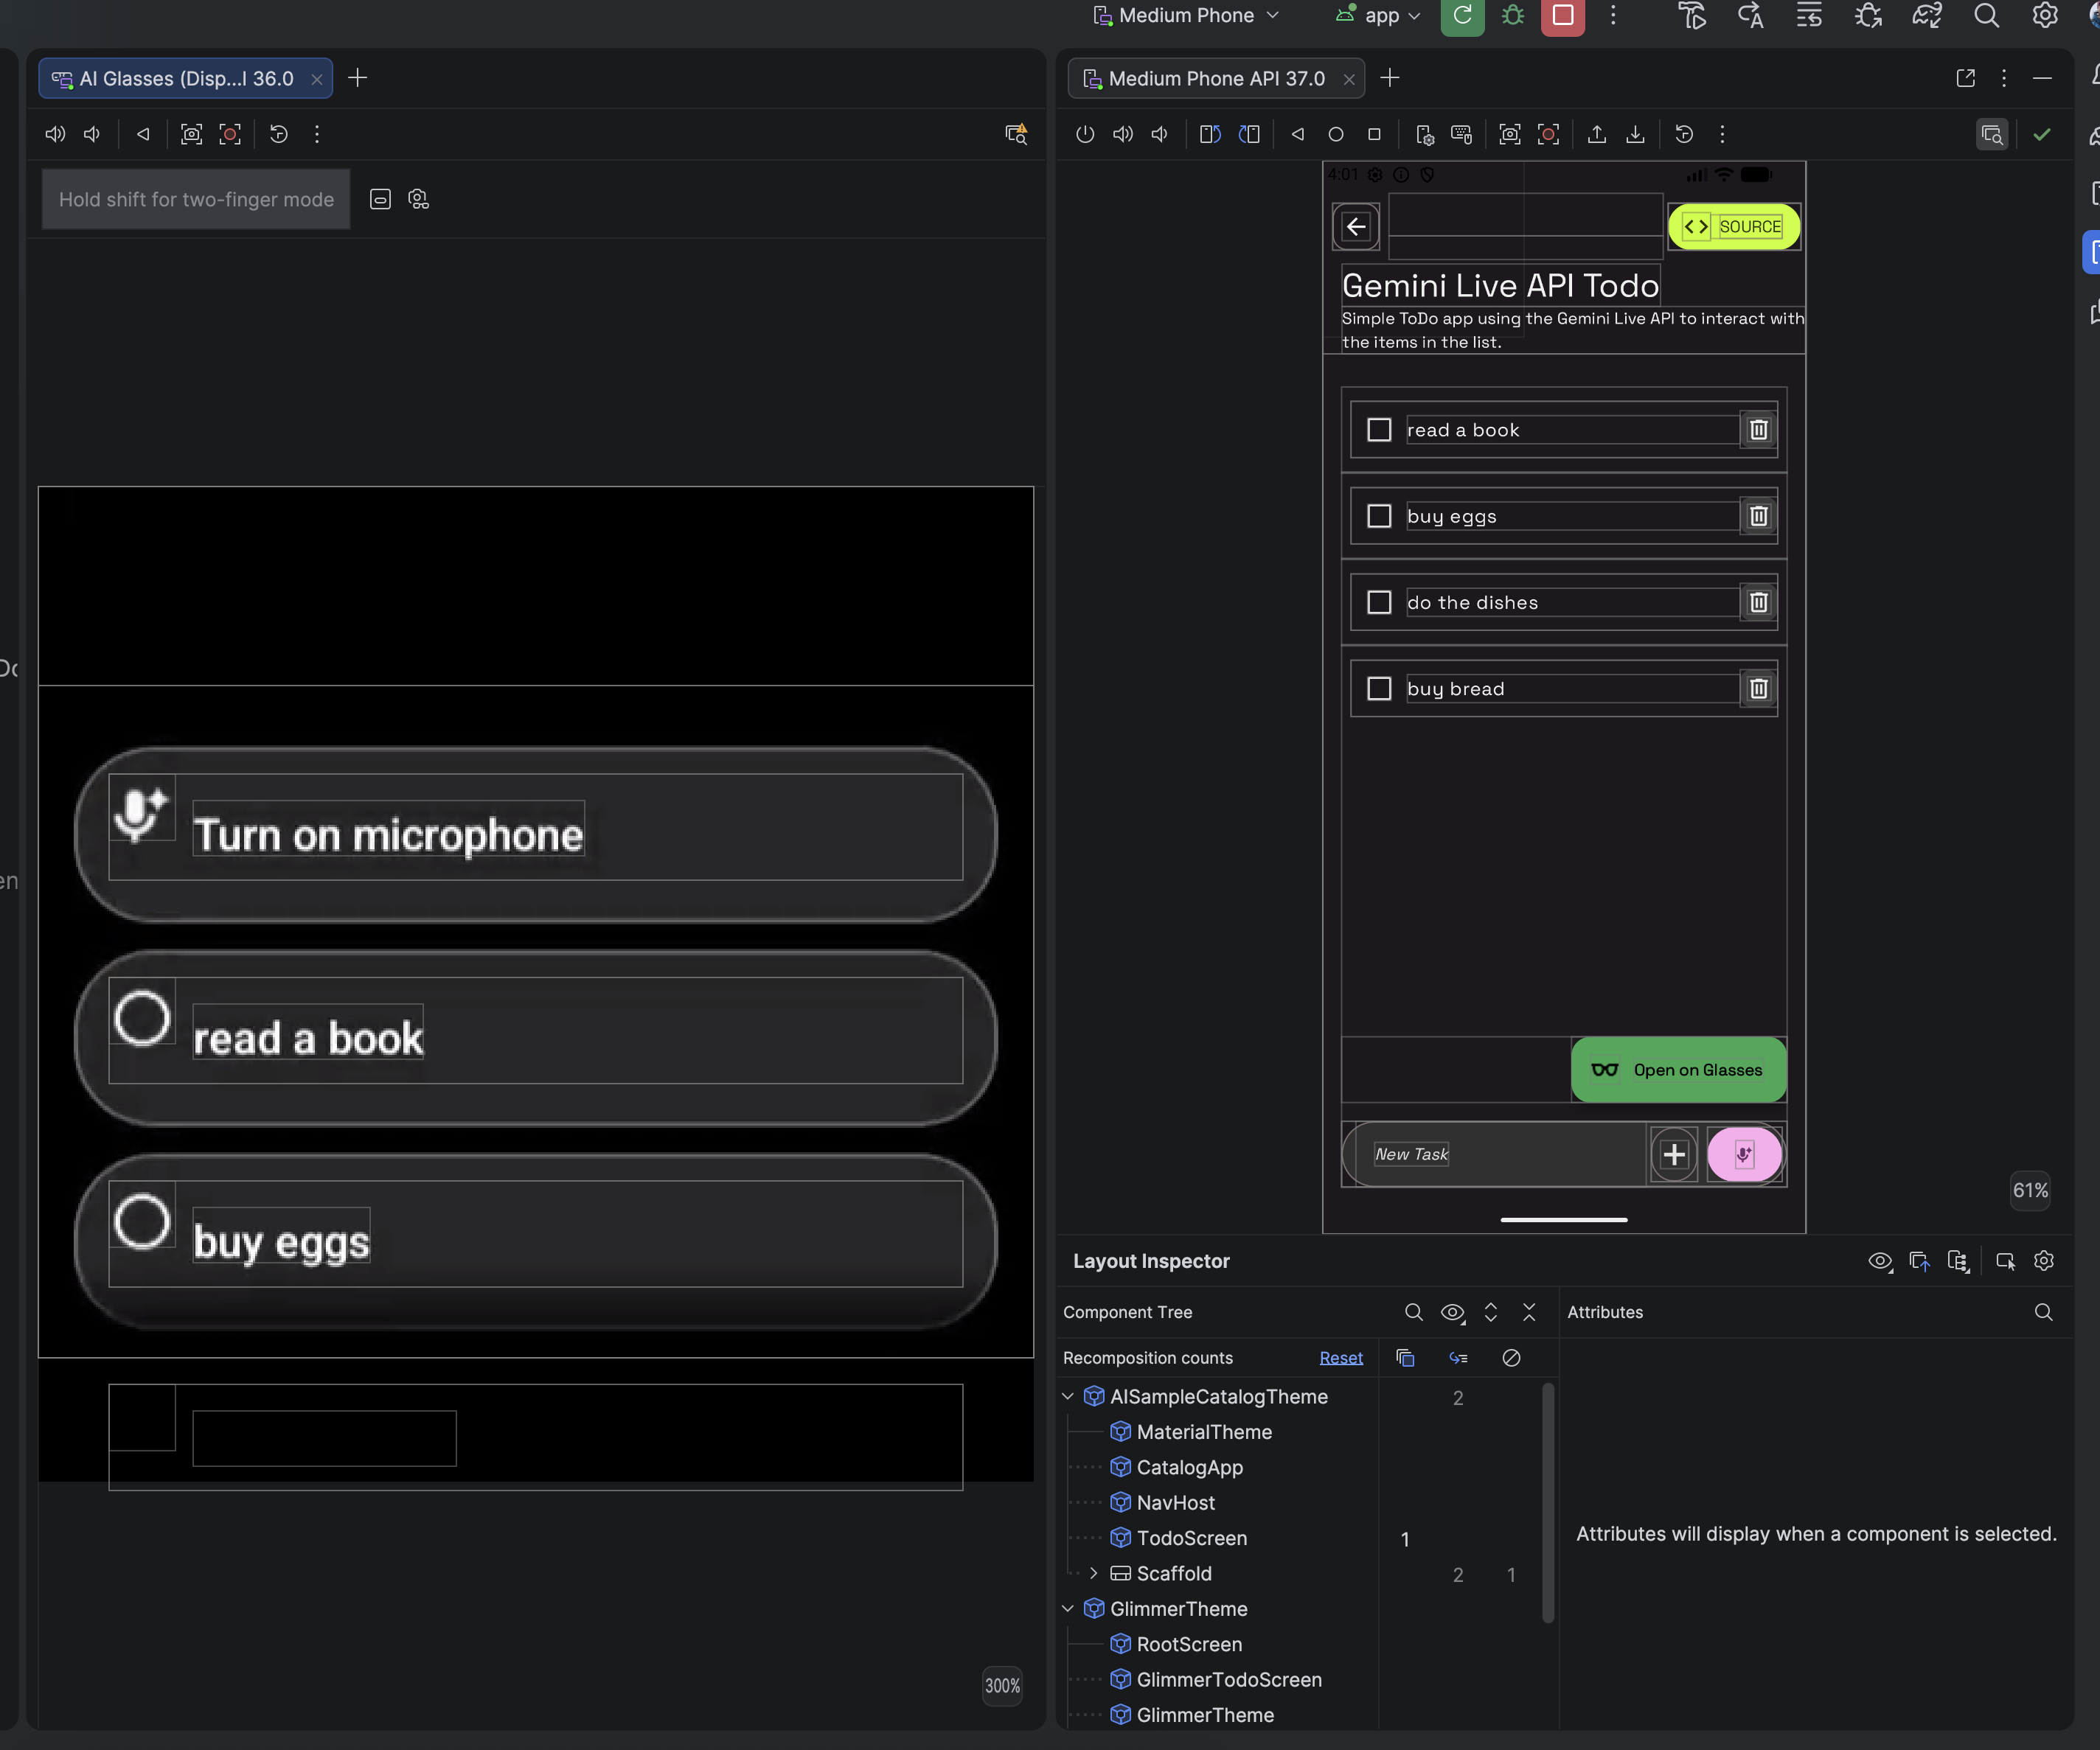
The Layout Inspector opens, along with the **Attributes** and the
**Component Tree** subpanels.
3. In the **Component Tree**, find the UI component for the display glasses.
Click the component to inspect its attributes.
## Inspect component attributes
As you interact with your app, click **Toggle Deep Inspect** to select a
component directly on the emulated devices. All of the layout attributes for a
selected component appear in the **Attributes** panel.
