Applicable XR devices This guidance helps you build experiences for these types of XR devices. [Learn about XR device types →](https://developer.android.com/develop/xr/devices)  XR Headsets [](https://developer.android.com/develop/xr/devices#xr-headsets)  Wired XR Glasses [](https://developer.android.com/develop/xr/devices#xr-glasses) [Learn about XR device types →](https://developer.android.com/develop/xr/devices)
The [Android XR Engine Hub](https://developer.android.com/develop/xr/engine-hub) lets you capture high-frequency
system and application performance traces directly from your connected Android
XR device. When a trace recording finishes, the Android XR Engine Hub
automatically performs the following actions:
- Saves the `.perfetto` trace file to your workstation and opens it in the [Perfetto Web UI](https://ui.perfetto.dev) with pre-configured viewport parameters (`visStart` and `visEnd`).
- Reduces the raw `.perfetto` capture locally on your workstation into a concise text summary of CPU and GPU utilization, frame timing statistics, and dropped frames.
- Sends the reduced trace summary to Gemini (when configured with your API key) to diagnose frame rate bottlenecks and provide actionable optimization recommendations directly inside the hub.
> [!NOTE]
> **Note:** Local trace reduction runs entirely on your host machine, so you don't need to upload large raw `.perfetto` files to analyze performance with Gemini.
## Configure your Gemini API key
AI-powered trace analysis uses a Bring Your Own Key (BYOK) workflow with a
[Google AI Studio](https://aistudio.google.com/) API key. If you don't configure an API key, you
can still record traces and inspect them in the Perfetto Web UI, but automated
Gemini diagnostics won't run.
To configure your Gemini API key:
1. Get a Gemini API key from [Google AI Studio](https://aistudio.google.com/).
2. Open the [Android XR Engine Hub](https://developer.android.com/develop/xr/engine-hub) and select **Settings** in the left navigation sidebar (or click **Add Gemini API Key in Settings** on the **Performance** page).
3. In the **Gemini API key** field, paste your API key.
4. Click **Save**.
You can update your key at any time, or clear the **Gemini API key** field
and click **Save** to remove the saved key from your workstation.
## Record and analyze a performance trace
Follow these steps to capture a performance trace from your connected Android XR
device and review the analysis:
1. Connect your Android XR device to your workstation using a USB-C cable and
select it from the device drop-down menu at the top of the
Android XR Engine Hub.
> [!NOTE]
> **Note:** Make sure that you've enabled [developer options](https://developer.android.com/studio/debug/dev-options#enable) and [USB debugging](https://developer.android.com/studio/debug/dev-options#Enable-debugging) on your Android XR device.
2. Launch the XR app or scene that you want to profile on your device.
3. In the left navigation sidebar of the Android XR Engine Hub, select
**Performance**.
4. In the **XR Device Tracing** card, click **Start Recording** and reproduce
the interaction or performance issue on your device.
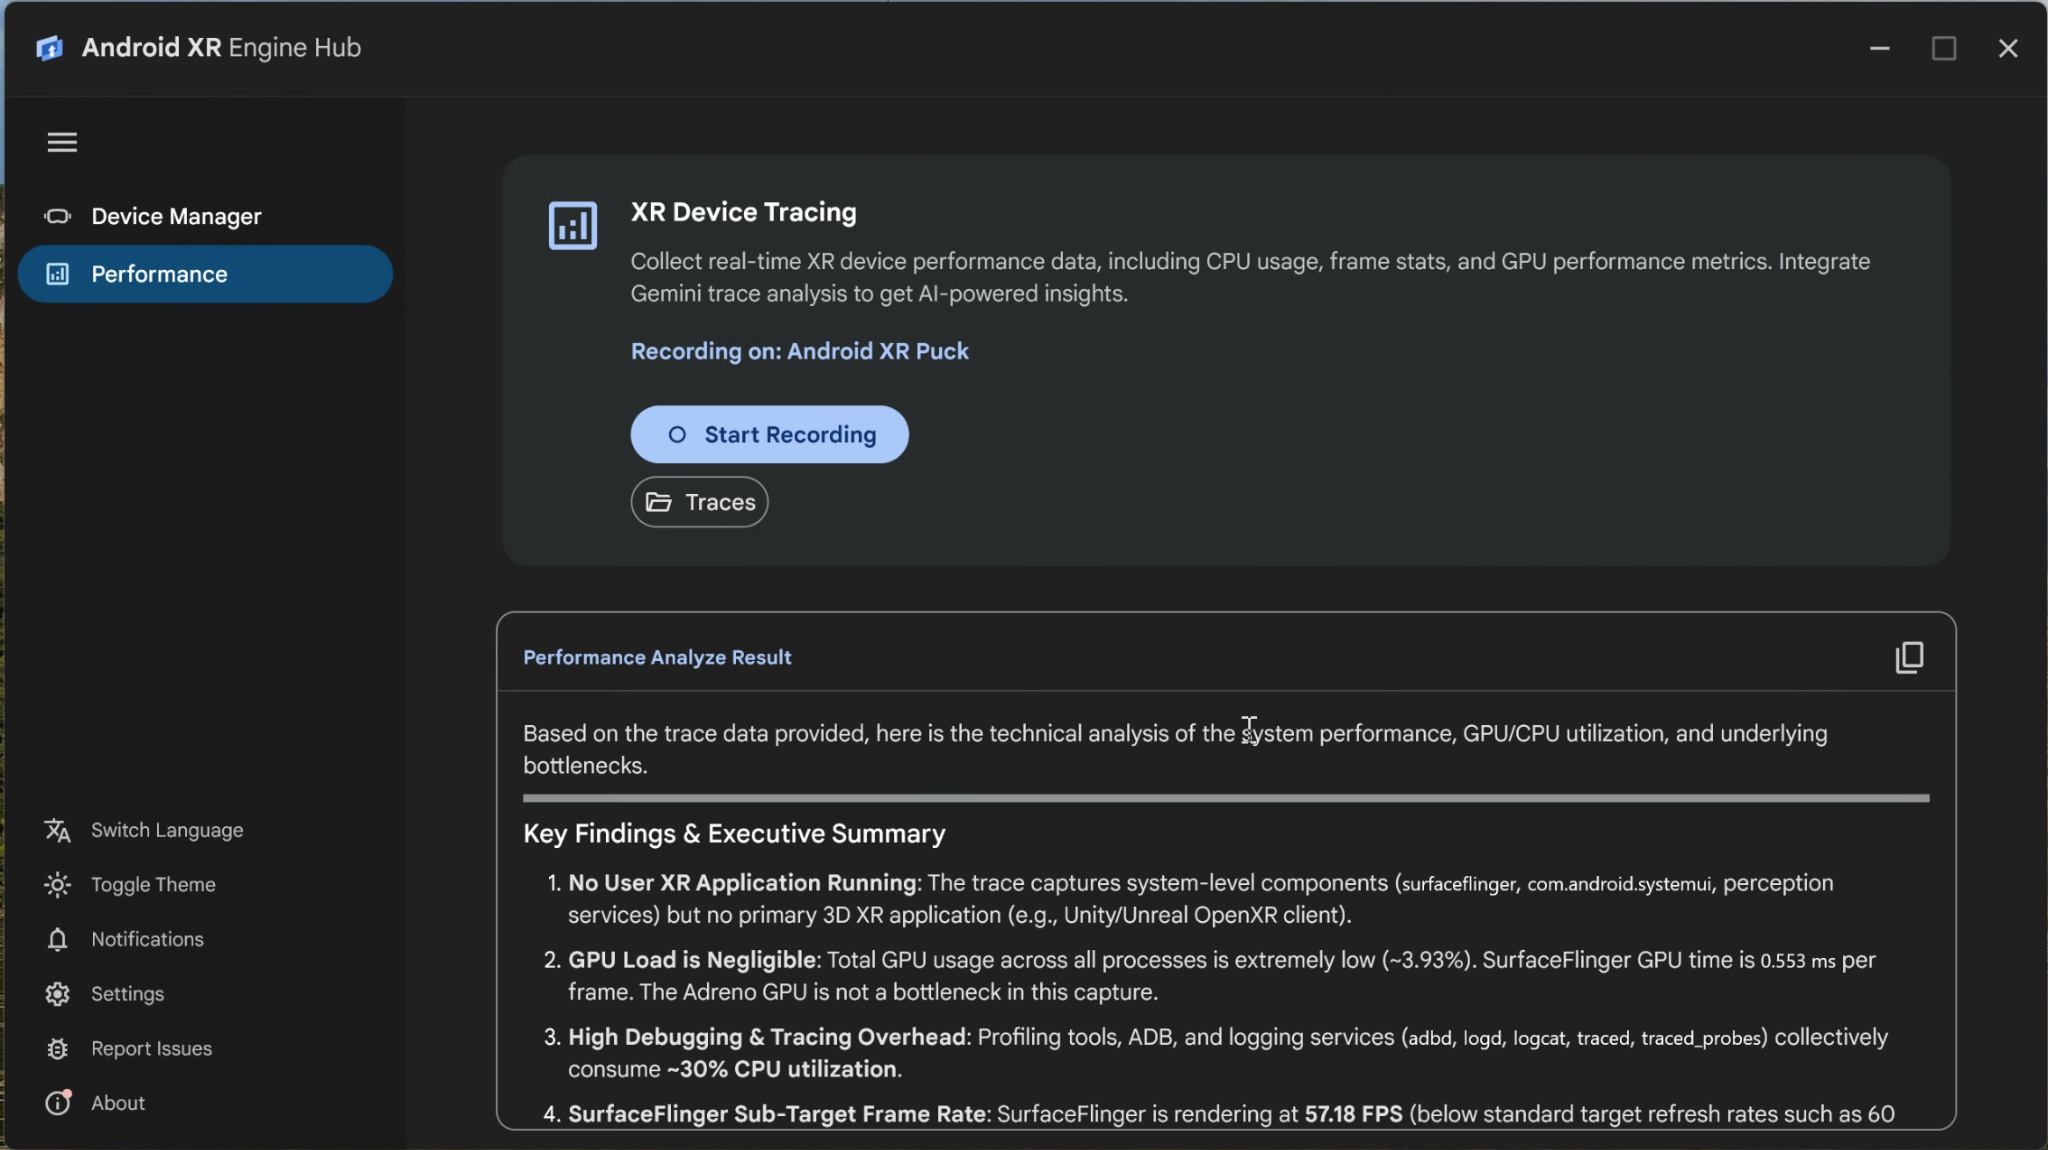
5. Click **Stop Recording** when you're done, or wait for the trace to stop
automatically when it reaches the 30-second time limit.
When the recording completes, the Android XR Engine Hub processes the capture
and provides your results in three ways:
- **Perfetto Web UI** : Your default browser opens the captured trace in the [Perfetto Web UI](https://ui.perfetto.dev) so that you can inspect detailed timeline tracks, shader compilation, and thread scheduling.
- **Performance Analyze Result** : If you've configured a Gemini API key, the **Performance Analyze Result** pane displays **Analyzing trace with Gemini** while the local trace summary is evaluated, and then renders a structured report highlighting key bottlenecks, missed frames, and suggested fixes. Click the copy icon in the top-right corner of the pane to copy the Markdown report to your clipboard.
- **Local trace files** : Click **Traces** in the **XR Device Tracing** card to open the local output folder containing your saved `.perfetto` files.